
Dashboard
Company has a low Debt to Equity ratio (avg) at 0.02 times
Healthy long term growth as Net Sales has grown by an annual rate of 45.50% and Operating profit at 204.13%
The company has declared Positive results for the last 4 consecutive quarters
With ROE of 14.9, it has a Very Expensive valuation with a 6 Price to Book Value
Reducing Promoter Confidence
Below par performance in long term as well as near term
Stock DNA
Industrial Manufacturing
INR 915 Cr (Micro Cap)
40.00
32
0.00%
0.02
14.91%
5.84
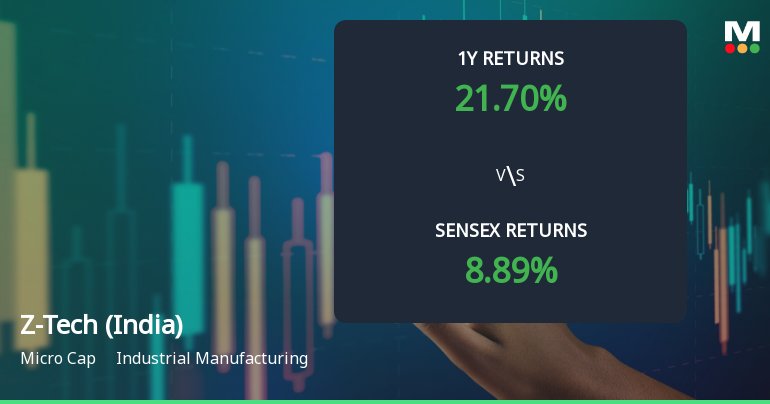
Total Returns (Price + Dividend) 
Z-Tech (India) for the last several years.
Risk Adjusted Returns v/s
Returns Beta

News
Z-Tech (India) Technical Momentum Shifts Signal Mildly Bullish Outlook
Z-Tech (India), a key player in the industrial manufacturing sector, has exhibited a notable shift in its technical momentum, moving from a sideways trend to a mildly bullish stance. This change is underscored by a combination of technical indicators, including MACD, RSI, moving averages, and volume-based metrics, which collectively suggest evolving market sentiment around the stock.
Read More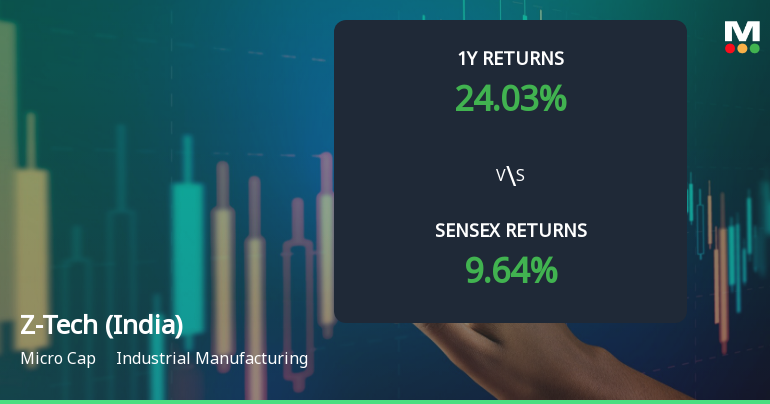
Z-Tech (India) Technical Momentum Shifts Amid Mixed Market Signals
Z-Tech (India), a key player in the industrial manufacturing sector, has exhibited notable shifts in its technical momentum as recent market data reveals a transition from a mildly bearish trend to a sideways movement. This development is underscored by a blend of bullish and neutral signals across various technical indicators, reflecting a complex market assessment for the stock.
Read More
Z-Tech (India) Sees Revision in Market Evaluation Amid Mixed Financial Signals
Z-Tech (India), a microcap player in the industrial manufacturing sector, has experienced a revision in its market evaluation reflecting a more cautious outlook. This shift follows a reassessment of key performance parameters including quality, valuation, financial trends, and technical indicators, signalling a nuanced perspective on the stock’s near-term prospects.
Read More Announcements
Corporate Actions

No Upcoming Board Meetings

No Dividend history available

No Splits history available

No Bonus history available

No Rights history available
Quality key factors
Valuation key factors
Technicals key factors
 Technical Indicator Scale: Bearish, Mildly Bearish, Sideways, Mildly Bullish, Bullish Turned
 Shareholding Snapshot : Sep 2025
Shareholding Compare (%holding)
Promoters
None
Held by 0 Schemes
Held by 3 FIIs (1.04%)
Terramaya Enterprises Private Limited (53.11%)
Ashish Kacholia (3.49%)
33.25%
Quarterly Results Snapshot (Standalone) - Sep'25 - QoQ

QoQ Growth in quarter ended Sep 2025 is 68.46% vs -41.47% in Jun 2025
QoQ Growth in quarter ended Sep 2025 is 99.34% vs -64.24% in Jun 2025
Half Yearly Results Snapshot (Standalone) - Sep'25
Growth in half year ended Sep 2025 is 55.88% vs 20.17% in Sep 2024
Growth in half year ended Sep 2025 is 70.09% vs 13.59% in Sep 2024
Nine Monthly Results Snapshot (Standalone) - Dec'24
Not Applicable: The company has declared_date for only one period
Not Applicable: The company has declared_date for only one period
Annual Results Snapshot (Consolidated) - Mar'25

YoY Growth in year ended Mar 2025 is 40.23% vs 161.64% in Mar 2024
YoY Growth in year ended Mar 2025 is 138.25% vs 329.95% in Mar 2024
About Z-Tech (India) Ltd

Company Coordinates


