
Dashboard
Weak Long Term Fundamental Strength with a -18.50% CAGR growth in Operating Profits over the last 5 years
- Low ability to service debt as the company has a high Debt to EBITDA ratio of 3.69 times
With a fall in Net Sales of -5.93%, the company declared Very Negative results in Sep 25
Reducing Promoter Confidence
Below par performance in long term as well as near term
Total Returns (Price + Dividend) 
Vishnu Prakash R for the last several years.
Risk Adjusted Returns v/s
Returns Beta

News
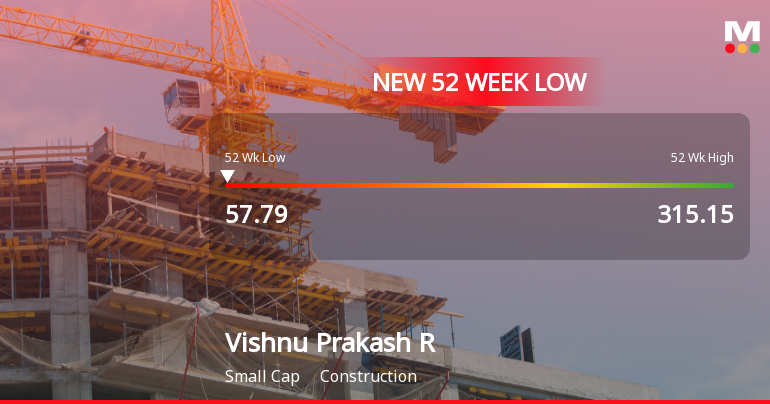
Vishnu Prakash R Punglia Stock Falls to 52-Week Low of Rs.57.79
Shares of Vishnu Prakash R Punglia have reached a new 52-week low of Rs.57.79, marking a significant decline amid a broader market that remains relatively stable. The stock has experienced a sustained downward trend over the past week, reflecting ongoing pressures within the construction sector.
Read More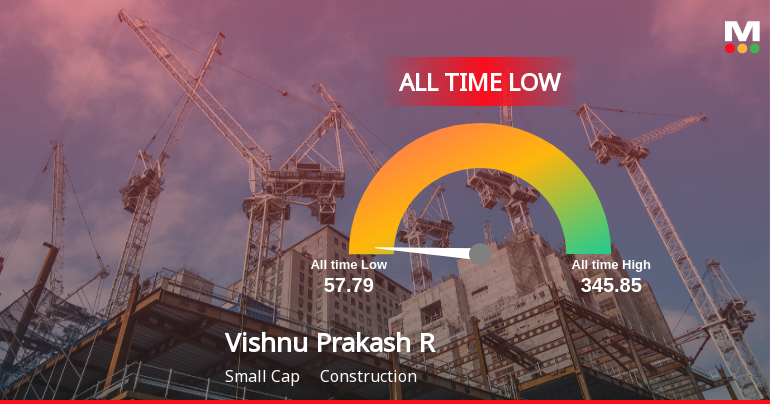
Vishnu Prakash R Punglia Stock Hits All-Time Low Amid Prolonged Downtrend
Shares of Vishnu Prakash R Punglia have reached a new all-time low of Rs.58.75, marking a significant milestone in the stock’s extended period of decline. The construction sector stock has experienced sustained downward pressure, reflecting a series of financial and market developments over recent months.
Read More
Announcements
Disclosures under Reg. 29(2) of SEBI (SAST) Regulations 2011
24-Dec-2025 | Source : BSEThe Exchange has received the disclosure under Regulation 29(2) of SEBI (Substantial Acquisition of Shares & Takeovers) Regulations 2011 for Pushpa Pungalia
Disclosures under Reg. 29(2) of SEBI (SAST) Regulations 2011
24-Dec-2025 | Source : BSEThe Exchange has received the disclosure under Regulation 29(2) of SEBI (Substantial Acquisition of Shares & Takeovers) Regulations 2011 for Anil Punglia
Disclosures under Reg. 29(2) of SEBI (SAST) Regulations 2011
24-Dec-2025 | Source : BSEThe Exchange has received the disclosure under Regulation 29(2) of SEBI (Substantial Acquisition of Shares & Takeovers) Regulations 2011 for Pushpa Devi Pungalia
Corporate Actions

No Upcoming Board Meetings

No Dividend history available

No Splits history available

No Bonus history available

No Rights history available
Quality key factors
Valuation key factors
Technicals key factors
 Technical Indicator Scale: Bearish, Mildly Bearish, Sideways, Mildly Bullish, Bullish Turned
 Shareholding Snapshot : Sep 2025
Shareholding Compare (%holding)
Promoters
3.0394
Held by 2 Schemes (4.08%)
Held by 12 FIIs (1.34%)
Vishnu Prakash Punglia (8.56%)
Quant Mutual Fund - Quant Small Cap Fund (4.08%)
29.65%
Quarterly Results Snapshot (Standalone) - Sep'25 - QoQ

QoQ Growth in quarter ended Sep 2025 is 6.98% vs -31.76% in Jun 2025
QoQ Growth in quarter ended Sep 2025 is -47.93% vs -56.83% in Jun 2025
Half Yearly Results Snapshot (Standalone) - Sep'25

Growth in half year ended Sep 2025 is -3.27% vs 2.93% in Sep 2024
Growth in half year ended Sep 2025 is -72.31% vs 2.18% in Sep 2024
Nine Monthly Results Snapshot (Standalone) - Dec'24
Not Applicable: The company has declared_date for only one period
Not Applicable: The company has declared_date for only one period
Annual Results Snapshot (Standalone) - Mar'25
YoY Growth in year ended Mar 2025 is -16.04% vs 26.14% in Mar 2024
YoY Growth in year ended Mar 2025 is -52.04% vs 34.81% in Mar 2024
About Vishnu Prakash R Punglia Ltd

Company Coordinates


