
Dashboard
Weak Long Term Fundamental Strength with a -13.96% CAGR growth in Operating Profits over the last 5 years
- Low ability to service debt as the company has a high Debt to EBITDA ratio of 3.95 times
- The company has been able to generate a Return on Equity (avg) of 2.54% signifying low profitability per unit of shareholders funds
- PAT(Q) At Rs -10.10 cr has Fallen at -264.8% (vs previous 4Q average)
- DPS(Y) Lowest at Rs 0.00
- DEBT-EQUITY RATIO(HY) Highest at 4.40 times
35.32% of Promoter Shares are Pledged
Below par performance in long term as well as near term
Stock DNA
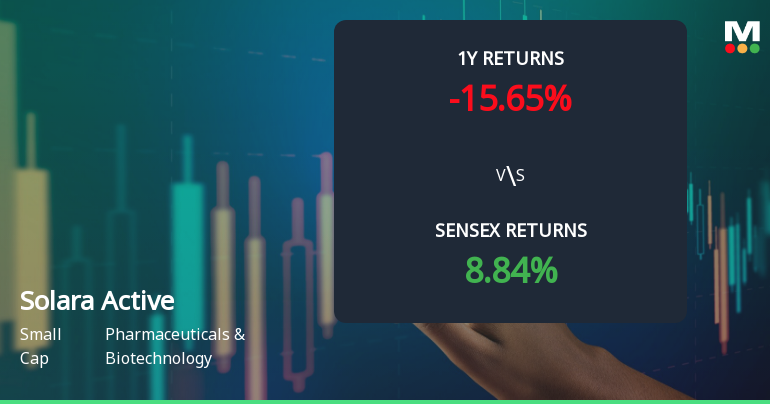
Pharmaceuticals & Biotechnology
INR 2,035 Cr (Small Cap)
318.00
34
0.00%
0.51
0.51%
1.62
Total Returns (Price + Dividend) 
Latest dividend: 3 per share ex-dividend date: Aug-18-2021
Risk Adjusted Returns v/s
Returns Beta

News
Solara Active Pharma Sciences Faces Technical Momentum Shift Amid Mixed Market Signals
Solara Active Pharma Sciences has experienced a notable shift in its technical momentum, reflecting a transition from a sideways trend to a mildly bearish stance. This change is underscored by a variety of technical indicators, including MACD, RSI, moving averages, and Bollinger Bands, which collectively paint a nuanced picture of the stock’s current market dynamics.
Read More
Solara Active Pharma Sciences Forms Death Cross Signalling Potential Bearish Trend
Solara Active Pharma Sciences has recently formed a Death Cross, a technical pattern where the 50-day moving average crosses below the 200-day moving average, often interpreted as a signal of potential long-term weakness and bearish momentum in the stock’s price trajectory.
Read More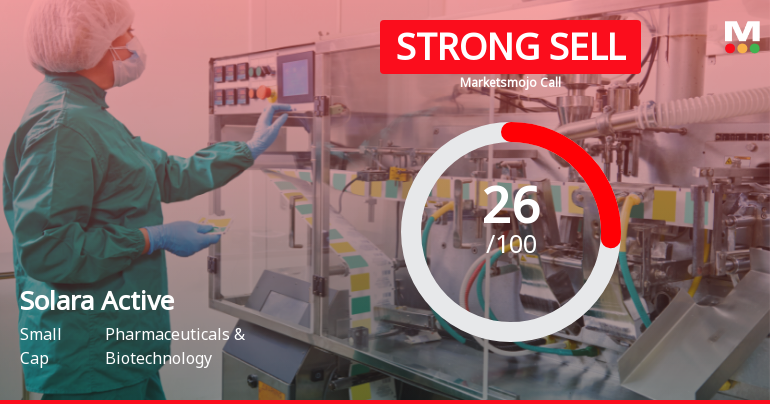
Solara Active Pharma Sciences: Analytical Perspective Shift Amidst Mixed Financial and Technical Signals
Solara Active Pharma Sciences has experienced a revision in its market assessment following a detailed review of its financial performance, valuation metrics, technical indicators, and overall quality parameters. This reassessment reflects a nuanced view of the company’s current position within the Pharmaceuticals & Biotechnology sector amid challenging market conditions and evolving investor sentiment.
Read More Announcements
Closure of Trading Window
24-Dec-2025 | Source : BSEIntimation regarding closure of Trading Window for the quarter and nine months ended December 31 2025
Announcement under Regulation 30 (LODR)-Change in Directorate
17-Dec-2025 | Source : BSESolara Active Pharma Sciences Limited has informed the exchange regarding appointment of Mr. Mohanraj S(DIN: 08420411) as Additional Executive Director and Whole Time Director with effect from January 01 2026.
Reconstitution Of The Management Committee
17-Dec-2025 | Source : BSESolara Active Pharma Sciences Limited has informed the exchange regarding the reconstitution of the Management Committee.
Corporate Actions

No Upcoming Board Meetings

Solara Active Pharma Sciences Ltd has declared 30% dividend, ex-date: 18 Aug 21

No Splits history available

No Bonus history available

Solara Active Pharma Sciences Ltd has announced 1:3 rights issue, ex-date: 15 May 24
Quality key factors
Valuation key factors
Technicals key factors
 Technical Indicator Scale: Bearish, Mildly Bearish, Sideways, Mildly Bullish, Bullish Turned
 Shareholding Snapshot : Sep 2025
Shareholding Compare (%holding)
Promoters
35.3205
Held by 3 Schemes (1.18%)
Held by 51 FIIs (13.58%)
Devicam Capital Llp . (15.5%)
Authum Investment And Infrastructure Limited (3.79%)
24.01%
Quarterly Results Snapshot (Consolidated) - Sep'25 - QoQ

QoQ Growth in quarter ended Sep 2025 is -1.76% vs 16.90% in Jun 2025
QoQ Growth in quarter ended Sep 2025 is -196.01% vs 600.95% in Jun 2025
Half Yearly Results Snapshot (Consolidated) - Sep'25
Growth in half year ended Sep 2025 is -10.94% vs -8.63% in Sep 2024

Growth in half year ended Sep 2025 is 107.71% vs 85.15% in Sep 2024
Nine Monthly Results Snapshot (Consolidated) - Dec'24
YoY Growth in nine months ended Dec 2024 is -1.51% vs -3.47% in Dec 2023
YoY Growth in nine months ended Dec 2024 is 100.85% vs -1,102.97% in Dec 2023
Annual Results Snapshot (Consolidated) - Mar'25
YoY Growth in year ended Mar 2025 is -0.40% vs -10.73% in Mar 2024
YoY Growth in year ended Mar 2025 is 100.10% vs -2,459.27% in Mar 2024
About Solara Active Pharma Sciences Ltd

Company Coordinates


