
Dashboard
Weak Long Term Fundamental Strength with a -6.89% CAGR growth in Operating Profits over the last 5 years
- Company's ability to service its debt is weak with a poor EBIT to Interest (avg) ratio of -0.01
- The company has been able to generate a Return on Equity (avg) of 3.34% signifying low profitability per unit of shareholders funds
Risky - Negative EBITDA
Below par performance in long term as well as near term
Total Returns (Price + Dividend) 
Sarda Proteins for the last several years.
Risk Adjusted Returns v/s
Returns Beta

News
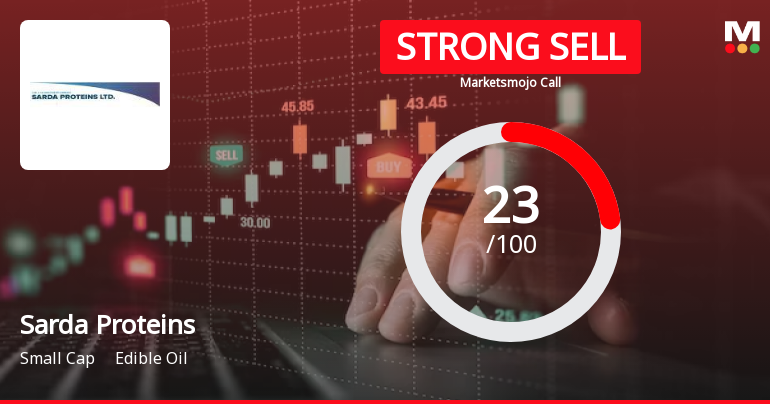
Sarda Proteins Ltd is Rated Strong Sell
Sarda Proteins Ltd is rated Strong Sell by MarketsMOJO, with this rating last updated on 12 Nov 2025. However, the analysis and financial metrics discussed here reflect the stock's current position as of 29 December 2025, providing investors with an up-to-date view of the company's fundamentals, valuation, financial trend, and technical outlook.
Read More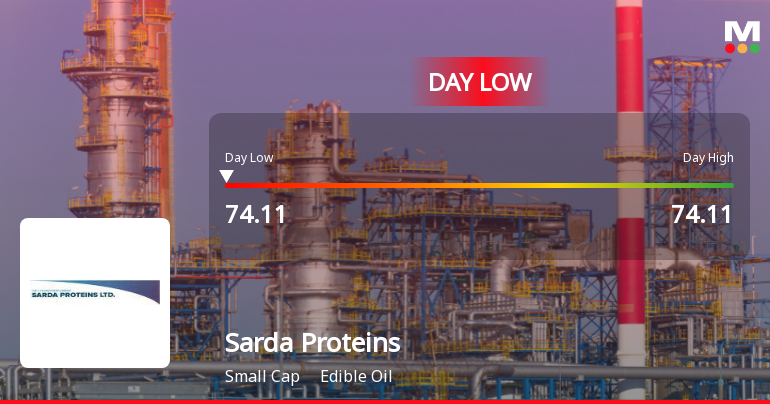
Sarda Proteins Hits Intraday Low Amid Price Pressure and Market Headwinds
Sarda Proteins experienced a significant intraday decline, touching a low of Rs 74.11, reflecting a price pressure of 9.74% during today’s trading session. The stock’s performance contrasted sharply with broader market trends, highlighting immediate pressures within the edible oil sector.
Read More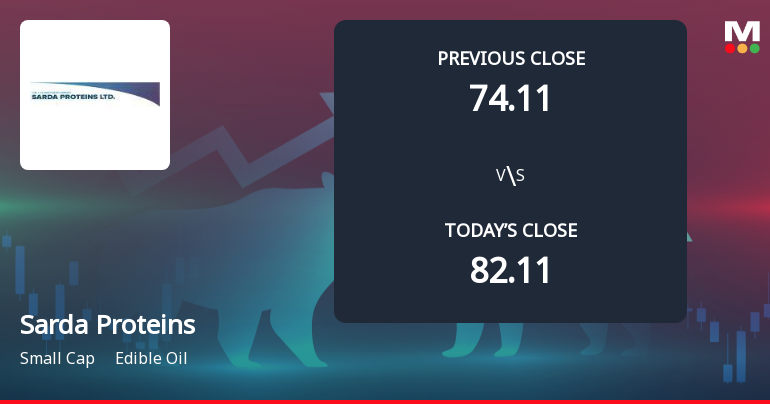
Sarda Proteins Opens with Sharp Gap Down Amid Market Concerns
Sarda Proteins witnessed a significant gap down at the opening of trading today, with the stock price declining by 9.74% to open at Rs 74.11. This sharp drop reflects heightened market concerns within the edible oil sector, as the stock underperformed both its sector peers and the broader Sensex index.
Read More Announcements
Closure of Trading Window
27-Dec-2025 | Source : BSEIntimation of Trading Window Closure
Board Meeting Outcome for Outcome Of Board Meeting Held On Monday 08-12-2025
08-Dec-2025 | Source : BSEOutcome of Board Meeting held on 08-12-2025
Announcement under Regulation 30 (LODR)-Change in Management
08-Dec-2025 | Source : BSEIntimation of appointment of additional directors of the Company
Corporate Actions

No Upcoming Board Meetings

No Dividend history available

No Splits history available

No Bonus history available

No Rights history available
Quality key factors
Valuation key factors
Technicals key factors
 Technical Indicator Scale: Bearish, Mildly Bearish, Sideways, Mildly Bullish, Bullish Turned
 Shareholding Snapshot : Sep 2024
Shareholding Compare (%holding)
Non Institution
None
Held by 0 Schemes
Held by 0 FIIs
Ritika Vegetable Oil Private Limited (0.0%)
Uday R Shah (huf) (4.26%)
89.2%
Quarterly Results Snapshot (Standalone) - Sep'25 - QoQ

QoQ Growth in quarter ended Sep 2025 is -60.73% vs 0.00% in Jun 2025

QoQ Growth in quarter ended Sep 2025 is 181.63% vs -345.45% in Jun 2025
Half Yearly Results Snapshot (Standalone) - Sep'25
Growth in half year ended Sep 2025 is 10,800.00% vs -41.67% in Sep 2024
Growth in half year ended Sep 2025 is -400.00% vs 400.00% in Sep 2024
Nine Monthly Results Snapshot (Standalone) - Mar'25
YoY Growth in nine months ended Mar 2025 is -88.71% vs -75.49% in Dec 2023
YoY Growth in nine months ended Mar 2025 is 0.00% vs 0.00% in Dec 2023
Annual Results Snapshot (Standalone) - Mar'25
YoY Growth in year ended Mar 2025 is 1,760.77% vs -77.59% in Mar 2024
YoY Growth in year ended Mar 2025 is -50.00% vs 166.67% in Mar 2024
About Sarda Proteins Ltd

Company Coordinates


