
Dashboard
Healthy long term growth as Operating profit has grown by an annual rate 30.38%
- NET SALES(Q) Highest at Rs 70.87 cr
- PAT(Q) Highest at Rs 9.85 cr.
- PBDIT(Q) Highest at Rs 17.04 cr.
With ROE of 8.6, it has a Fair valuation with a 3.6 Price to Book Value
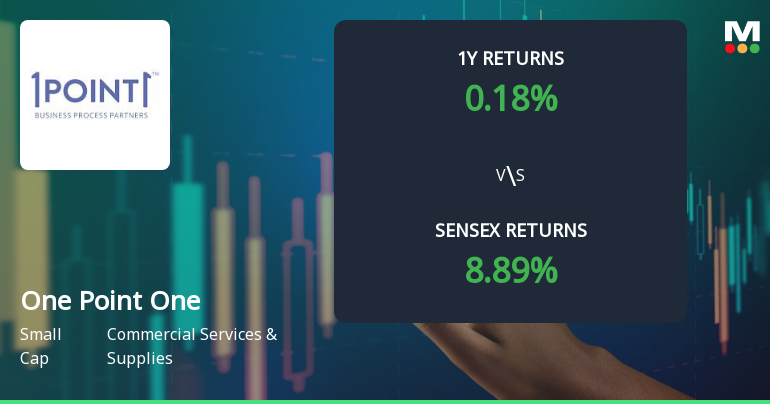
Below par performance in long term as well as near term
Stock DNA
Commercial Services & Supplies
INR 1,518 Cr (Small Cap)
42.00
35
0.00%
0.08
8.57%
3.55
Total Returns (Price + Dividend) 
Latest dividend: 0 per share ex-dividend date: Sep-12-2019
Risk Adjusted Returns v/s
Returns Beta

News
One Point One Solutions Shows Mixed Technical Signals Amid Mildly Bullish Momentum
One Point One Solutions, a player in the Commercial Services & Supplies sector, has exhibited a shift in its technical momentum, moving from a sideways trend to a mildly bullish stance. Recent market data and technical indicators reveal a nuanced picture of the stock’s price action, with mixed signals across key metrics such as MACD, RSI, moving averages, and volume-based indicators.
Read More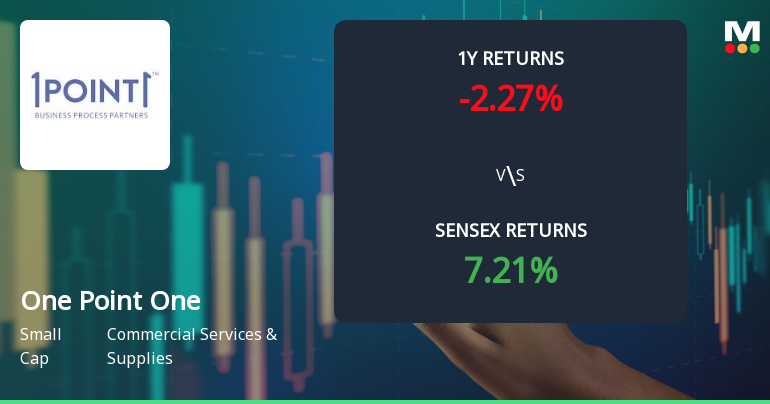
One Point One Solutions Shows Mixed Technical Signals Amid Price Momentum Shift
One Point One Solutions, a player in the Commercial Services & Supplies sector, has experienced a notable shift in its technical parameters, reflecting a nuanced change in price momentum. Recent market data reveals a transition from a mildly bearish trend to a sideways movement, accompanied by a blend of bullish and mildly bearish signals across key technical indicators such as MACD, RSI, Bollinger Bands, and moving averages.
Read More
One Point One Sees Revised Market Evaluation Amid Mixed Performance Metrics
One Point One, a small-cap player in the Commercial Services & Supplies sector, has experienced a revision in its market evaluation following recent changes in its fundamental and technical parameters. This shift reflects a nuanced view of the company’s current standing amid fluctuating stock returns and sector dynamics.
Read More Announcements
One Point One Solutions Limited - Outcome of Board Meeting
15-Nov-2019 | Source : NSEOne Point One Solutions Limited has informed the Exchange regarding Outcome of Board Meeting held on November 14, 2019.
One Point One Solutions Limited - Trading Window
17-Oct-2019 | Source : NSEOne Point One Solutions Limited has informed the Exchange regarding the Trading Window closure pursuant to SEBI (Prohibition of Insider Trading) Regulations, 2015
One Point One Solutions Limited - Statement of deviation(s) or variation(s) under Reg. 32
16-Oct-2019 | Source : NSEOne Point One Solutions Limited has informed the Exchange regarding Statement of deviation(s) or variation(s) under Reg. 32 of SEBI (LODR) Regulations 2015
Corporate Actions

No Upcoming Board Meetings

One Point One Solutions Ltd has declared 1% dividend, ex-date: 12 Sep 19

One Point One Solutions Ltd has announced 2:10 stock split, ex-date: 18 Jan 22

One Point One Solutions Ltd has announced 1:2 bonus issue, ex-date: 18 Jan 22

No Rights history available
Quality key factors
Valuation key factors
Technicals key factors
 Technical Indicator Scale: Bearish, Mildly Bearish, Sideways, Mildly Bullish, Bullish Turned
 Shareholding Snapshot : Oct 2025
Shareholding Compare (%holding)
Promoters
20.2598
Held by 0 Schemes
Held by 17 FIIs (15.9%)
Akshay Chhabra (30.62%)
Gkk Capital Markets Private Limited (2.47%)
22.93%
Quarterly Results Snapshot (Consolidated) - Sep'25 - YoY

YoY Growth in quarter ended Sep 2025 is 13.43% vs 56.67% in Sep 2024
YoY Growth in quarter ended Sep 2025 is 17.54% vs 41.32% in Sep 2024
Half Yearly Results Snapshot (Consolidated) - Sep'25
Growth in half year ended Sep 2025 is 13.14% vs 63.51% in Sep 2024
Growth in half year ended Sep 2025 is 20.64% vs 82.74% in Sep 2024
Nine Monthly Results Snapshot (Consolidated) - Dec'24

YoY Growth in nine months ended Dec 2024 is 61.24% vs 12.27% in Dec 2023
YoY Growth in nine months ended Dec 2024 is 65.90% vs 152.05% in Dec 2023
Annual Results Snapshot (Consolidated) - Mar'25
YoY Growth in year ended Mar 2025 is 51.01% vs 21.04% in Mar 2024
YoY Growth in year ended Mar 2025 is 55.10% vs 143.23% in Mar 2024
About One Point One Solutions Ltd

Company Coordinates


