

Devyani International Ltd is Rated Strong Sell
2025-12-29 10:10:04Devyani International Ltd is rated Strong Sell by MarketsMOJO, with this rating last updated on 07 Nov 2025. However, the analysis and financial metrics discussed here reflect the stock's current position as of 29 December 2025, providing investors with the latest insights into the company’s performance and outlook.
Read More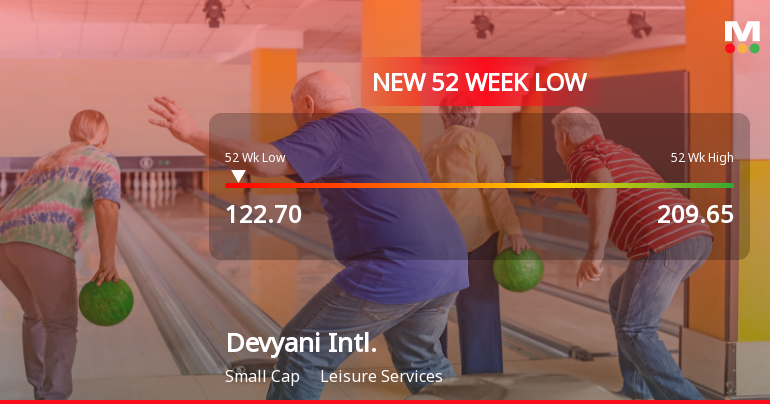
Devyani International Stock Falls to 52-Week Low of Rs.122.7
2025-12-18 10:14:26Devyani International's shares reached a fresh 52-week low of Rs.122.7 today, marking a significant decline amid a series of consecutive losses. The stock has been trading below all major moving averages and has underperformed its sector and benchmark indices over the past year.
Read More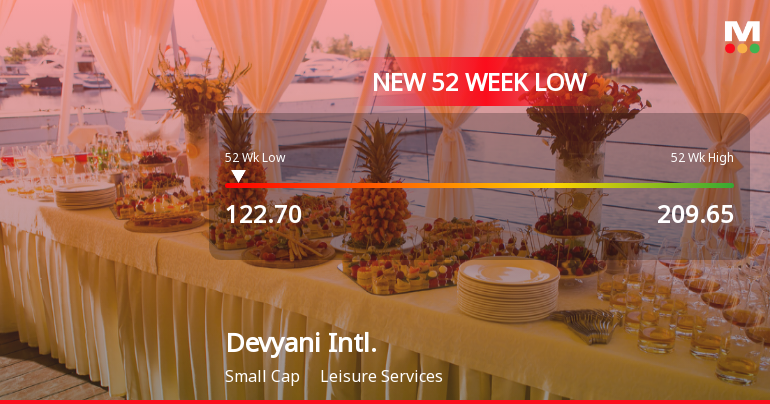
Devyani International Stock Falls to 52-Week Low of Rs.122.7
2025-12-18 10:14:24Devyani International's shares reached a fresh 52-week low of Rs.122.7 today, marking a significant decline amid a series of consecutive losses. The stock has been trading below all major moving averages and has underperformed its sector and benchmark indices over the past year.
Read More
Devyani Intl. Sees Revision in Market Evaluation Amidst Challenging Financials
2025-12-18 10:10:25Devyani International has experienced a notable revision in its market evaluation, reflecting a shift in analytical perspective driven by recent financial and technical developments. The leisure services company’s performance metrics and market behaviour have prompted a reassessment of its standing within the sector.
Read More
Devyani International Stock Falls to 52-Week Low of Rs.129.35
2025-12-16 12:22:44Devyani International's shares reached a fresh 52-week low today, touching Rs.129.35 amid a continued downward trend. The stock has underperformed its sector and broader market indices, reflecting ongoing pressures within the Leisure Services industry.
Read More
Devyani Intl. Sees Revision in Market Evaluation Amid Challenging Financial Trends
2025-11-27 10:05:56Devyani Intl., a small-cap player in the Leisure Services sector, has experienced a notable revision in its market evaluation, reflecting shifts in its fundamental and technical outlook. This adjustment comes amid a backdrop of subdued financial performance and valuation concerns, underscoring the challenges faced by the company in the current market environment.
Read MoreIs Devyani Intl. overvalued or undervalued?
2025-11-18 08:25:36As of 17 November 2025, the valuation grade for Devyani International has moved from fair to expensive, indicating that the company is currently overvalued. The key ratios highlight this concern, with a staggering PE ratio of -569.29, a Price to Book Value of 11.33, and an EV to EBIT of 106.94. These figures suggest significant financial distress and a lack of profitability, which is further underscored by a negative ROE of -1.99%. In comparison to its peers, Devyani International's valuation appears particularly unfavorable. For instance, Page Industries has a PE ratio of 57.64 and an EV to EBITDA of 39.40, while Sapphire Foods is rated fair with a PE of 2619.06 and an EV to EBITDA of 20.45. The stark contrast in these ratios reinforces the conclusion that Devyani International is overvalued. Additionally, the company's stock has underperformed against the Sensex, with a year-to-date return of -21.44% com...
Read More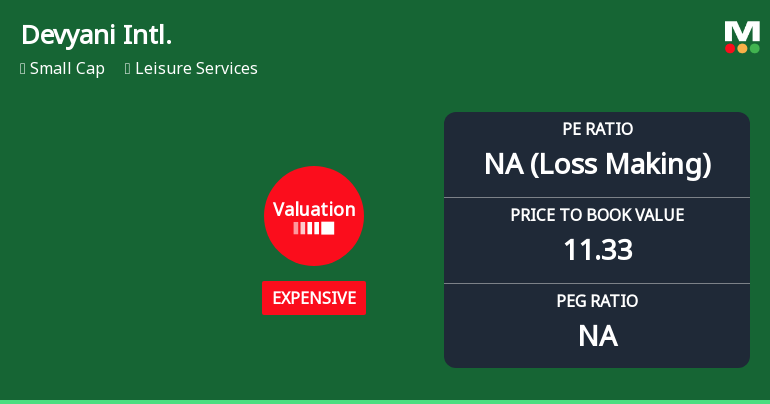
Devyani International Faces Valuation Grade Change Amidst Profitability Challenges and Underperformance
2025-11-18 08:03:41Devyani International, a small-cap in the leisure services sector, faces significant profitability challenges, reflected in its negative PE ratio and high EV to EBITDA. The company has underperformed in returns compared to the Sensex and shows less favorable valuation metrics compared to peers, indicating a competitive struggle.
Read MoreIs Devyani Intl. technically bullish or bearish?
2025-11-17 08:07:53As of 14 November 2025, the technical trend for Devyani Intl. has changed from mildly bearish to bearish. The current stance is bearish with a strong indication from multiple indicators. The MACD is bearish on both weekly and monthly time frames, and Bollinger Bands also reflect a bearish outlook in both time frames. Daily moving averages confirm the bearish trend. The KST is bearish on both weekly and monthly levels. Although the Dow Theory shows a mildly bearish stance on the weekly and monthly charts, the overall technical indicators strongly support a bearish view. The OBV indicates a mildly bearish trend on the weekly but is bullish on the monthly, suggesting some divergence. Overall, the bearish sentiment is reinforced by the significant negative returns compared to the Sensex over various periods, particularly the year-to-date return of -24.03%....
Read MoreClosure of Trading Window
27-Dec-2025 | Source : BSEIntimation of closure of trading window
Announcement under Regulation 30 (LODR)-Change in Management
12-Dec-2025 | Source : BSEDisclosure regarding change in Senior Management Personnel
Disclosure Under Regulation 30 Of The SEBI (Listing Obligations And Disclosure Requirements) Regulations 2015 - ESG Rating
11-Dec-2025 | Source : BSEIntimation of ESG Rating
Corporate Actions

No Upcoming Board Meetings

No Dividend history available

No Splits history available

No Bonus history available

No Rights history available


