
Dashboard
Poor long term growth as Net Sales has grown by an annual rate of 8.39% and Operating profit at 1.61% over the last 5 years
- NET SALES(Q) At Rs 209.73 cr has Fallen at -19.99%
- PBDIT(Q) Lowest at Rs 32.76 cr.
- OPERATING PROFIT TO NET SALES (Q) Lowest at 15.62%
With ROCE of 8.4, it has a Very Expensive valuation with a 3.6 Enterprise value to Capital Employed
Underperformed the market in the last 1 year
Stock DNA
Aerospace & Defense
INR 5,877 Cr (Small Cap)
55.00
28
0.22%
0.22
7.47%
4.05
Total Returns (Price + Dividend) 
Latest dividend: 0.7 per share ex-dividend date: Mar-25-2025
Risk Adjusted Returns v/s
Returns Beta

News

Mishra Dhatu Nigam Ltd is Rated Strong Sell
Mishra Dhatu Nigam Ltd is rated Strong Sell by MarketsMOJO. This rating was last updated on 21 Nov 2025, reflecting a reassessment of the stock’s outlook. However, the analysis below presents the company’s current fundamentals, returns, and financial metrics as of 26 December 2025, providing investors with the latest perspective on its performance and prospects.
Read More
Mishra Dhatu Nig Sees Revision in Market Assessment Amid Challenging Financial Trends
Mishra Dhatu Nig, a small-cap player in the Aerospace & Defense sector, has experienced a revision in its market evaluation reflecting recent financial and technical developments. This shift highlights the company's ongoing challenges in growth and valuation metrics, impacting investor sentiment and positioning within its sector.
Read More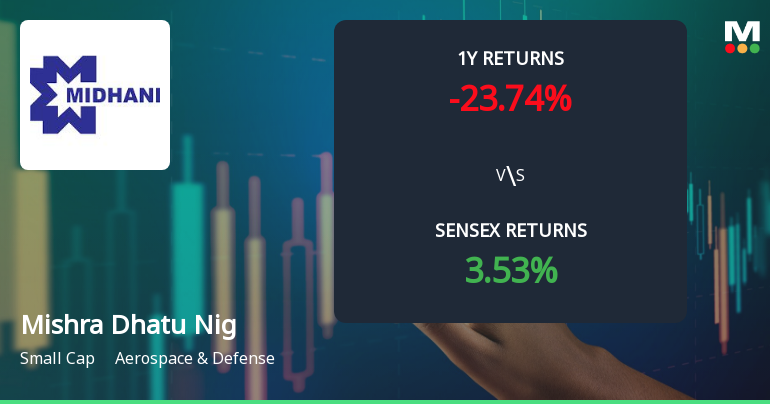
Mishra Dhatu Nigam Faces Bearish Momentum Amid Technical Indicator Shifts
Mishra Dhatu Nigam's stock price has exhibited a notable shift in momentum, with technical indicators signalling a bearish trend across multiple timeframes. The aerospace and defence company’s shares have experienced downward pressure, reflecting broader market assessment changes and evolving technical parameters.
Read More Announcements
Announcement under Regulation 30 (LODR)-Award_of_Order_Receipt_of_Order
18-Dec-2025 | Source : BSEInformation regarding receipt of an Order.
Intimation Under Regulation 30 Of SEBI (Listing Obligations And Disclosures Requirements) Regulations 2015 (SEBI LODR).
29-Nov-2025 | Source : BSEBSE Limited(BSE) and National Stock Exchange( NSE) imposed fine for the Quarter ended on September 30 2025
Intimation Under Regulation 30 Of SEBI (Listing Obligations And Disclosures Requirements) Regulations 2015 (SEBI LODR)
28-Nov-2025 | Source : BSEBSE Limited (BSE) imposed a fine for the quarter ended on September 30 2025
Corporate Actions

No Upcoming Board Meetings

Mishra Dhatu Nigam Ltd has declared 7% dividend, ex-date: 25 Mar 25

No Splits history available

No Bonus history available

No Rights history available
Quality key factors
Valuation key factors
Technicals key factors
 Technical Indicator Scale: Bearish, Mildly Bearish, Sideways, Mildly Bullish, Bullish Turned
 Shareholding Snapshot : Sep 2025
Shareholding Compare (%holding)
Promoters
None
Held by 8 Schemes (7.17%)
Held by 75 FIIs (1.37%)
The President Of India (74.0%)
Hdfc Trustee Company Ltd. A/c Hdfc Balanced Advantage Fund (3.44%)
13.86%
Quarterly Results Snapshot (Consolidated) - Sep'25 - YoY

YoY Growth in quarter ended Sep 2025 is -19.99% vs 15.22% in Sep 2024
YoY Growth in quarter ended Sep 2025 is -45.59% vs 71.00% in Sep 2024
Half Yearly Results Snapshot (Consolidated) - Sep'25
Growth in half year ended Sep 2025 is -10.66% vs 2.50% in Sep 2024
Growth in half year ended Sep 2025 is -10.96% vs -10.81% in Sep 2024
Nine Monthly Results Snapshot (Consolidated) - Dec'24
YoY Growth in nine months ended Dec 2024 is -0.55% vs 26.51% in Dec 2023

YoY Growth in nine months ended Dec 2024 is 20.22% vs -49.51% in Dec 2023
Annual Results Snapshot (Consolidated) - Mar'25
YoY Growth in year ended Mar 2025 is 0.13% vs 23.02% in Mar 2024
YoY Growth in year ended Mar 2025 is 20.77% vs -41.26% in Mar 2024
About Mishra Dhatu Nigam Ltd

Company Coordinates


