
Dashboard
With ROE of 8.1, it has a Very Expensive valuation with a 5.8 Price to Book Value
- The stock is trading at a discount compared to its peers' average historical valuations
- Over the past year, while the stock has generated a return of -42.86%, its profits have risen by 59.5% ; the PEG ratio of the company is 1.4
Underperformed the market in the last 1 year
Stock DNA
Industrial Manufacturing
INR 26,974 Cr (Mid Cap)
72.00
54
0.00%
-0.04
8.09%
5.82
Total Returns (Price + Dividend) 
Kaynes Tech for the last several years.
Risk Adjusted Returns v/s
Returns Beta

News
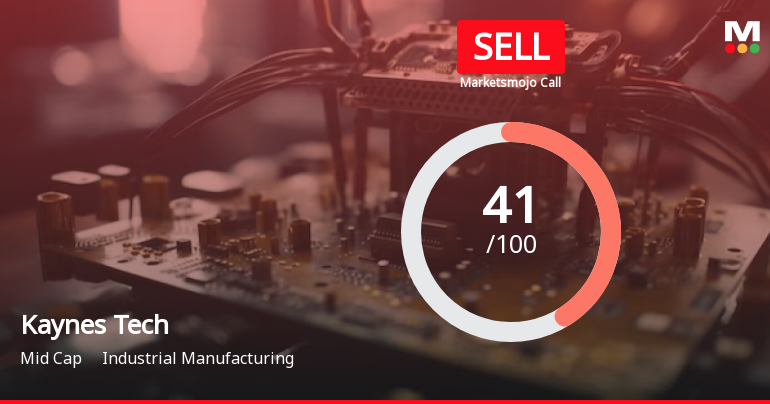
Kaynes Technology India Ltd is Rated Sell
Kaynes Technology India Ltd is rated Sell by MarketsMOJO, with this rating last updated on 01 Dec 2025. However, the analysis and financial metrics discussed here reflect the company’s current position as of 28 December 2025, providing investors with the latest insights into its performance and outlook.
Read More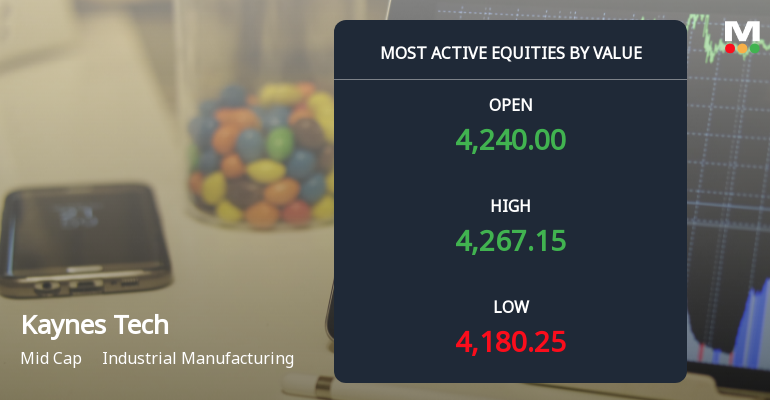
Kaynes Technology India Sees Robust Trading Activity Amid Sector-Aligned Performance
Kaynes Technology India Ltd has emerged as one of the most actively traded stocks by value on 22 Dec 2025, reflecting significant investor interest within the industrial manufacturing sector. The stock’s trading volume and value underscore its liquidity and market participation, while its price movements align closely with sector trends.
Read More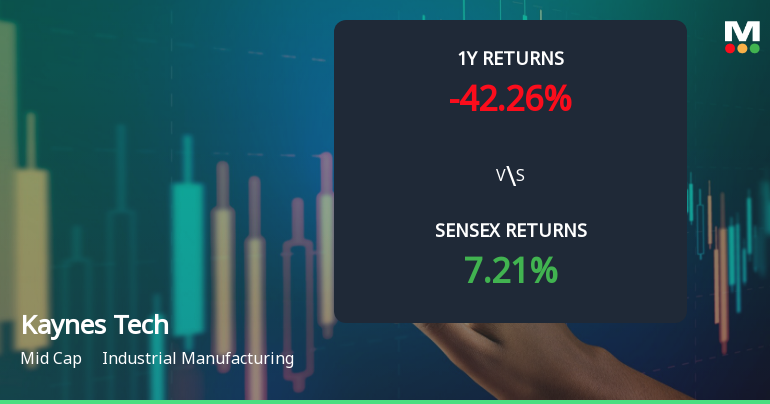
Kaynes Technology India Faces Bearish Momentum Amid Mixed Technical Signals
Kaynes Technology India, a key player in the industrial manufacturing sector, is currently exhibiting a shift in price momentum as technical indicators reveal a predominantly bearish outlook. Despite a recent uptick in daily price, broader weekly and monthly signals suggest caution for investors as the stock navigates a challenging technical landscape.
Read More Announcements
Closure of Trading Window
23-Dec-2025 | Source : BSEClosure of Trading Window
Announcement under Regulation 30 (LODR)-Credit Rating
19-Dec-2025 | Source : BSECredit Rating Report received from CARE Ratings Limited
Announcement under Regulation 30 (LODR)-Press Release / Media Release
16-Dec-2025 | Source : BSEPress Release
Corporate Actions

No Upcoming Board Meetings

No Dividend history available

No Splits history available

No Bonus history available

No Rights history available
Quality key factors
Valuation key factors
Technicals key factors
 Technical Indicator Scale: Bearish, Mildly Bearish, Sideways, Mildly Bullish, Bullish Turned
 Shareholding Snapshot : Sep 2025
Shareholding Compare (%holding)
Promoters
None
Held by 34 Schemes (20.65%)
Held by 245 FIIs (10.71%)
Ramesh Kunhikannan (53.49%)
Motilal Oswal Midcap Fund (4.18%)
8.89%
Quarterly Results Snapshot (Consolidated) - Sep'25 - QoQ

QoQ Growth in quarter ended Sep 2025 is 34.56% vs -31.59% in Jun 2025
QoQ Growth in quarter ended Sep 2025 is 62.73% vs -35.79% in Jun 2025
Half Yearly Results Snapshot (Consolidated) - Sep'25

Growth in half year ended Sep 2025 is 46.80% vs 63.53% in Sep 2024
Growth in half year ended Sep 2025 is 76.62% vs 94.86% in Sep 2024
Nine Monthly Results Snapshot (Consolidated) - Dec'24
YoY Growth in nine months ended Dec 2024 is 48.83% vs 53.28% in Dec 2023
YoY Growth in nine months ended Dec 2024 is 73.72% vs 89.45% in Dec 2023
Annual Results Snapshot (Consolidated) - Mar'25
YoY Growth in year ended Mar 2025 is 50.82% vs 60.25% in Mar 2024
YoY Growth in year ended Mar 2025 is 60.09% vs 92.53% in Mar 2024
About Kaynes Technology India Ltd

Company Coordinates


