
Dashboard
Negative results in Sep 25
- PBT LESS OI(Q) At Rs 12.04 cr has Fallen at -33.74%
- PAT(Q) At Rs 11.16 cr has Fallen at -30.3%
- ROCE(HY) Lowest at 19.37%
With ROE of 17.5, it has a Expensive valuation with a 6 Price to Book Value
Despite the size of the company, domestic mutual funds hold only 0% of the company
Underperformed the market in the last 1 year
Stock DNA
Industrial Manufacturing
INR 2,671 Cr (Small Cap)
35.00
33
0.47%
-0.02
17.46%
6.05
Total Returns (Price + Dividend) 
Latest dividend: 1.2 per share ex-dividend date: Sep-09-2025
Risk Adjusted Returns v/s
Returns Beta

News

Jash Engineering Ltd is Rated Strong Sell
Jash Engineering Ltd is rated Strong Sell by MarketsMOJO, with this rating last updated on 25 Nov 2025. While the rating change occurred on that date, the analysis and financial metrics discussed here reflect the company’s current position as of 25 December 2025, providing investors with the latest insights into the stock’s fundamentals, valuation, financial trends, and technical outlook.
Read More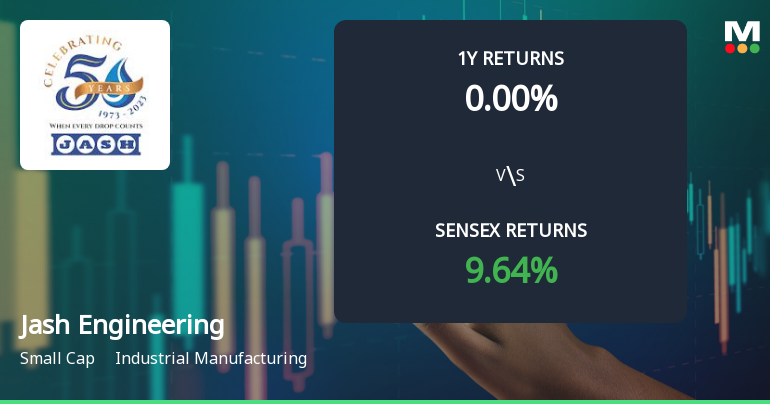
Jash Engineering Technical Momentum Shifts Amid Industrial Manufacturing Sector Trends
Jash Engineering, a key player in the industrial manufacturing sector, has exhibited notable shifts in its technical momentum, reflecting evolving market dynamics. Recent assessment changes highlight a transition in technical indicators, signalling a nuanced shift in price momentum and investor sentiment amid broader sectoral trends.
Read More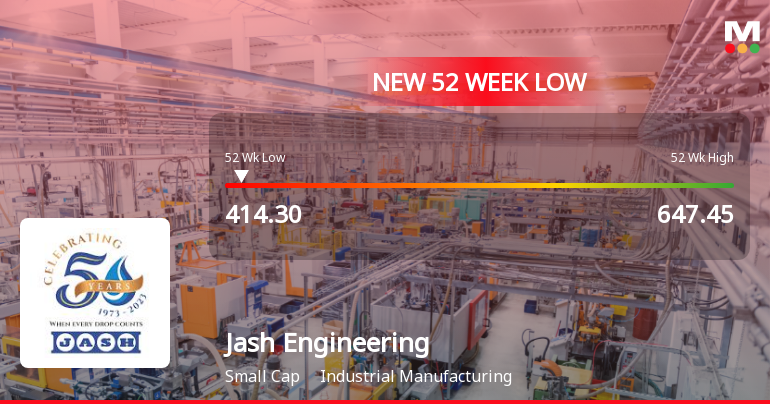
Jash Engineering Falls to 52-Week Low of Rs.414.3 Amidst Continued Downtrend
Jash Engineering, a key player in the Industrial Manufacturing sector, has reached a fresh 52-week low of Rs.414.3, marking a significant price level after a series of declines over recent sessions. The stock’s performance reflects ongoing pressures within the company’s financial metrics and market positioning.
Read More Announcements
Corporate Actions

No Upcoming Board Meetings

Jash Engineering Ltd has declared 60% dividend, ex-date: 09 Sep 25

Jash Engineering Ltd has announced 2:10 stock split, ex-date: 30 Oct 24

No Bonus history available

No Rights history available
Quality key factors
Valuation key factors
Technicals key factors
 Technical Indicator Scale: Bearish, Mildly Bearish, Sideways, Mildly Bullish, Bullish Turned
 Shareholding Snapshot : Sep 2025
Shareholding Compare (%holding)
Non Institution
None
Held by 0 Schemes
Held by 38 FIIs (2.06%)
Pratik Patel (12.05%)
Axel Schutte (3.96%)
38.28%
Quarterly Results Snapshot (Consolidated) - Sep'25 - YoY

YoY Growth in quarter ended Sep 2025 is 12.87% vs 46.69% in Sep 2024
YoY Growth in quarter ended Sep 2025 is -30.29% vs 87.47% in Sep 2024
Half Yearly Results Snapshot (Consolidated) - Sep'25
Growth in half year ended Sep 2025 is 12.21% vs 59.46% in Sep 2024
Growth in half year ended Sep 2025 is -63.17% vs 219.34% in Sep 2024
Nine Monthly Results Snapshot (Consolidated) - Dec'24

YoY Growth in nine months ended Dec 2024 is 45.66% vs 28.03% in Dec 2023
YoY Growth in nine months ended Dec 2024 is 85.44% vs 50.57% in Dec 2023
Annual Results Snapshot (Consolidated) - Mar'25
YoY Growth in year ended Mar 2025 is 42.57% vs 28.28% in Mar 2024
YoY Growth in year ended Mar 2025 is 31.35% vs 29.15% in Mar 2024
About Jash Engineering Ltd

Company Coordinates


