
Dashboard
Low ability to service debt as the company has a high Debt to EBITDA ratio of 4.18 times
- Low ability to service debt as the company has a high Debt to EBITDA ratio of 4.18 times
- The company has been able to generate a Return on Equity (avg) of 9.06% signifying low profitability per unit of shareholders funds
Poor long term growth as Operating profit has grown by an annual rate -185.53% of over the last 5 years
The company has declared Negative results for the last 12 consecutive quarters
Risky - Negative Operating Profits
Falling Participation by Institutional Investors
Stock DNA
Pharmaceuticals & Biotechnology
INR 2,137 Cr (Small Cap)
NA (Loss Making)
34
0.09%
1.00
-11.33%
2.20
Total Returns (Price + Dividend) 
Latest dividend: 0.2 per share ex-dividend date: Sep-04-2025
Risk Adjusted Returns v/s
Returns Beta

News
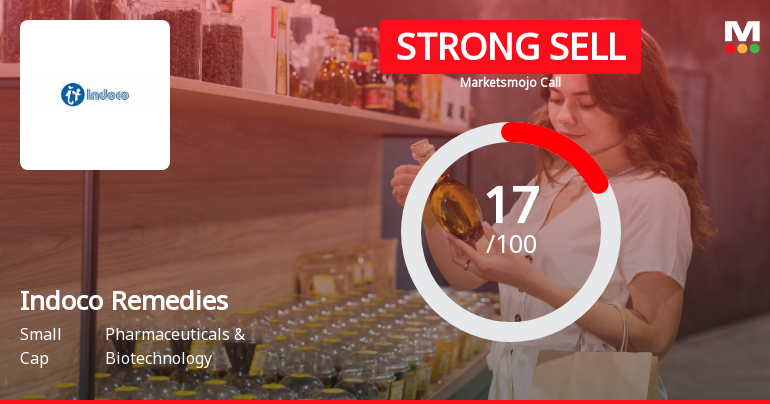
Indoco Remedies Ltd is Rated Strong Sell
Indoco Remedies Ltd is rated Strong Sell by MarketsMOJO. This rating was last updated on 06 Dec 2025. However, the analysis and financial metrics presented here reflect the stock's current position as of 25 December 2025, providing investors with the latest insights into the company’s performance and outlook.
Read More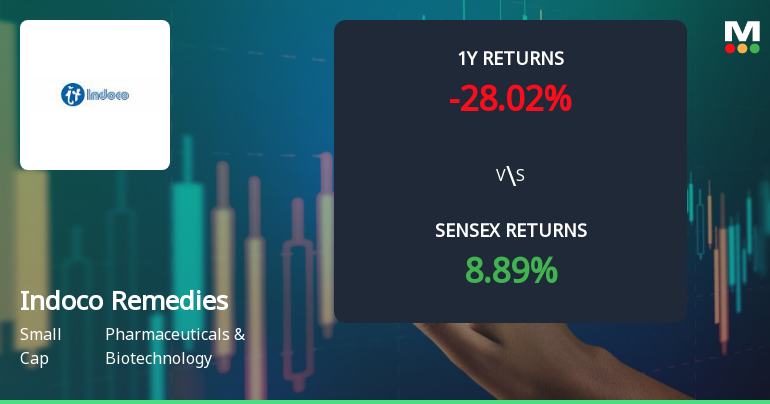
Indoco Remedies Technical Momentum Shifts Amid Bearish Market Signals
Indoco Remedies has experienced a notable shift in its technical momentum, with recent evaluation adjustments reflecting a predominantly bearish outlook across multiple timeframes. The stock’s price action, combined with key technical indicators such as MACD, RSI, and moving averages, suggests a cautious stance for investors amid ongoing sector challenges and broader market dynamics.
Read More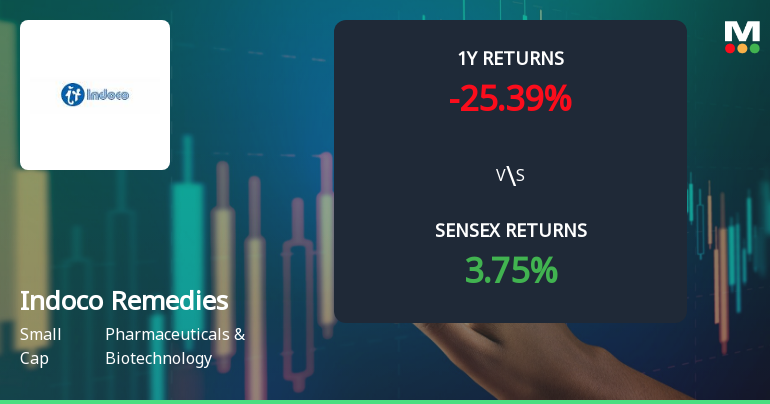
Indoco Remedies Technical Momentum Shifts Amid Challenging Market Returns
Indoco Remedies has experienced a notable shift in its technical momentum, reflecting a complex interplay of market forces and evaluation adjustments. Despite a recent uptick in daily price, the pharmaceutical company’s longer-term returns continue to lag behind broader market benchmarks, underscoring the challenges faced within the Pharmaceuticals & Biotechnology sector.
Read More Announcements
Disclosures under Reg. 10(5) in respect of acquisition under Reg. 10(1)(a) of SEBI (SAST) Regulations 2011
19-Dec-2025 | Source : BSEThe Exchange has received the disclosure under Regulation 10(5) in respect of acquisition under Regulation 10(1)(a) of SEBI (Substantial Acquisition of Shares & Takeovers) Regulations 2011 for Kare Family Pvt Trust
Disclosures under Reg. 10(7) of SEBI (SAST) Regulations 2011
15-Dec-2025 | Source : BSEThe Exchange has received the disclosure under Regulation 10(7) in respect of acquisition under Regulation 10(1)(a)(i)of SEBI (Substantial Acquisition of Shares & Takeovers) Regulations 2011 for Kare Family Pvt Trust
Announcement under Regulation 30 (LODR)-Press Release / Media Release
11-Dec-2025 | Source : BSEPress Release regarding receipt of Establishment Inspection Report from the USFDA for the Companys API manufacturing facility located at Patalganga
Corporate Actions

No Upcoming Board Meetings

Indoco Remedies Ltd has declared 10% dividend, ex-date: 04 Sep 25

Indoco Remedies Ltd has announced 2:10 stock split, ex-date: 17 May 12

Indoco Remedies Ltd has announced 1:2 bonus issue, ex-date: 17 May 12

No Rights history available
Quality key factors
Valuation key factors
Technicals key factors
 Technical Indicator Scale: Bearish, Mildly Bearish, Sideways, Mildly Bullish, Bullish Turned
 Shareholding Snapshot : Sep 2025
Shareholding Compare (%holding)
Promoters
None
Held by 8 Schemes (17.58%)
Held by 35 FIIs (1.25%)
Spa Holdings Pvt Ltd (19.88%)
Nippon Life India Trustee Ltd A/c Nippon India Small Cap Fund (4.8%)
16.4%
Quarterly Results Snapshot (Consolidated) - Sep'25 - QoQ

QoQ Growth in quarter ended Sep 2025 is 10.23% vs 12.68% in Jun 2025

QoQ Growth in quarter ended Sep 2025 is 77.84% vs 11.39% in Jun 2025
Half Yearly Results Snapshot (Consolidated) - Sep'25
Growth in half year ended Sep 2025 is 6.97% vs -4.85% in Sep 2024
Growth in half year ended Sep 2025 is -529.83% vs -111.67% in Sep 2024
Nine Monthly Results Snapshot (Consolidated) - Dec'24
YoY Growth in nine months ended Dec 2024 is -6.80% vs 10.25% in Dec 2023
YoY Growth in nine months ended Dec 2024 is -143.99% vs -34.94% in Dec 2023
Annual Results Snapshot (Consolidated) - Mar'25
YoY Growth in year ended Mar 2025 is -8.38% vs 8.91% in Mar 2024
YoY Growth in year ended Mar 2025 is -174.89% vs -30.78% in Mar 2024
About Indoco Remedies Ltd

Company Coordinates


