
Dashboard
High Management Efficiency with a high ROCE of 85.81%
Strong ability to service debt as the company has a low Debt to EBITDA ratio of 0.15 times
Poor long term growth as Operating profit has grown by an annual rate 5.23% of over the last 5 years
Flat results in Sep 25
With ROCE of 82.4, it has a Very Expensive valuation with a 14.2 Enterprise value to Capital Employed
90.28% of Promoter Shares are Pledged
Market Beating performance in long term as well as near term
With its market cap of Rs 2,20,752 cr, it is the biggest company in the sector and constitutes 44.28% of the entire sector
Stock DNA
Non - Ferrous Metals
INR 227,428 Cr (Large Cap)
22.00
20
0.00%
0.23
77.13%
16.12
Total Returns (Price + Dividend) 
Latest dividend: 19 per share ex-dividend date: Aug-28-2024
Risk Adjusted Returns v/s
Returns Beta

News
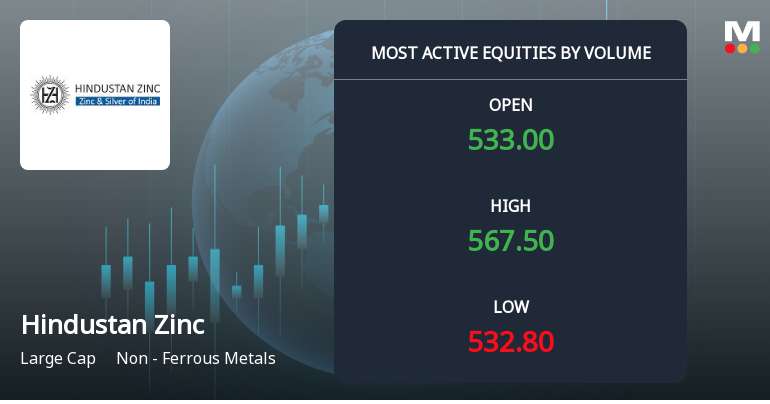
Hindustan Zinc Sees Exceptional Trading Volume Amidst Sector Gains
Hindustan Zinc Ltd has emerged as one of the most actively traded stocks on 12 December 2025, registering a significant surge in volume and price momentum that outpaces its sector peers. The stock’s performance reflects heightened investor interest and notable accumulation signals within the non-ferrous metals industry.
Read More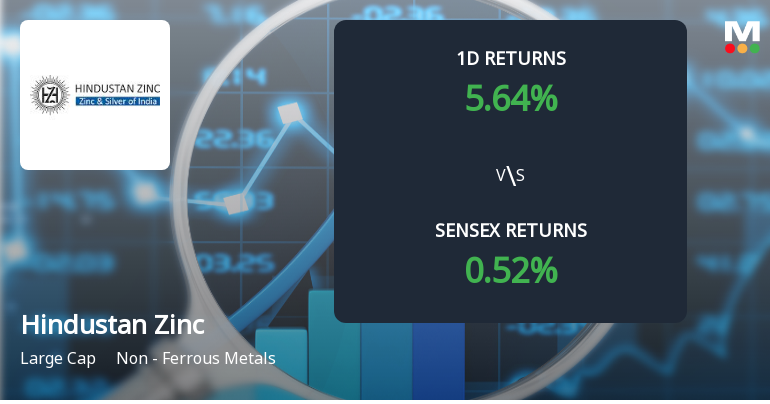
Hindustan Zinc Sees Significant Open Interest Surge Amid Strong Market Momentum
Hindustan Zinc Ltd has witnessed a notable surge in open interest in its derivatives segment, coinciding with a robust price rally and heightened trading volumes. This development reflects evolving market positioning and investor interest in the non-ferrous metals sector, with the stock reaching a fresh 52-week high and outperforming its peers.
Read More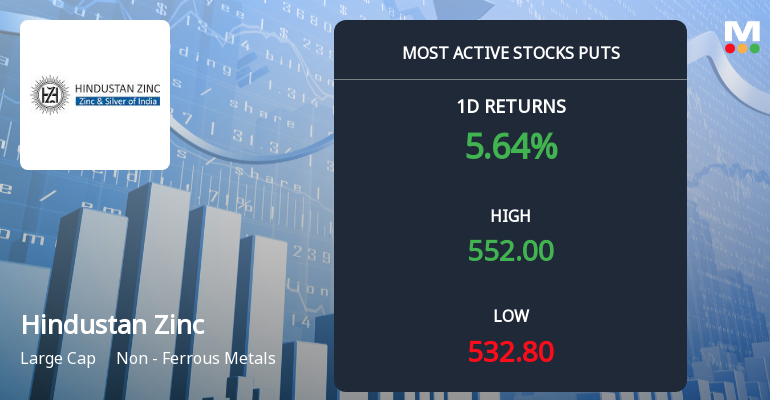
Hindustan Zinc Sees Heavy Put Option Activity Amid Bullish Price Momentum
Hindustan Zinc Ltd has emerged as the most active stock in put options trading, with significant activity centred around the 30 December 2025 expiry. Despite this, the stock has demonstrated robust price gains, hitting a new 52-week high of Rs 549 and outperforming its sector in recent sessions, signalling a complex interplay between bearish option positioning and underlying bullish momentum.
Read More Announcements
Announcement under Regulation 30 (LODR)-Analyst / Investor Meet - Intimation
09-Dec-2025 | Source : BSEPlease find enclosed.
Disclosure Under Regulation 30 Of The SEBI (Listing Obligations And Disclosure Requirements) Regulations 2015
06-Dec-2025 | Source : BSEPlease refer the enclosed file.
Announcement under Regulation 30 (LODR)-Newspaper Publication
21-Nov-2025 | Source : BSEPlease refer the enclosed file
Corporate Actions

No Upcoming Board Meetings

Hindustan Zinc Ltd has declared 950% dividend, ex-date: 28 Aug 24

Hindustan Zinc Ltd has announced 2:10 stock split, ex-date: 07 Mar 11

Hindustan Zinc Ltd has announced 1:1 bonus issue, ex-date: 07 Mar 11

No Rights history available
Quality key factors
Valuation key factors
Technicals key factors
 Technical Indicator Scale: Bearish, Mildly Bearish, Sideways, Mildly Bullish, Bullish Turned
 Shareholding Snapshot : Sep 2025
Shareholding Compare (%holding)
Promoters
90.2847
Held by 36 Schemes (0.98%)
Held by 195 FIIs (1.31%)
Vedanta Limited (61.84%)
President Of India - A/c Hindustan Zinc Ltd . (27.92%)
3.28%
Quarterly Results Snapshot (Consolidated) - Sep'25 - QoQ

QoQ Growth in quarter ended Sep 2025 is 10.01% vs -14.48% in Jun 2025
QoQ Growth in quarter ended Sep 2025 is 18.58% vs -25.61% in Jun 2025
Half Yearly Results Snapshot (Consolidated) - Sep'25

Growth in half year ended Sep 2025 is -0.38% vs 16.41% in Sep 2024
Growth in half year ended Sep 2025 is 4.52% vs 26.51% in Sep 2024
Nine Monthly Results Snapshot (Consolidated) - Dec'24
YoY Growth in nine months ended Dec 2024 is 16.90% vs -16.44% in Dec 2023
YoY Growth in nine months ended Dec 2024 is 28.47% vs -27.84% in Dec 2023
Annual Results Snapshot (Consolidated) - Mar'25
YoY Growth in year ended Mar 2025 is 17.80% vs -15.15% in Mar 2024
YoY Growth in year ended Mar 2025 is 33.43% vs -26.18% in Mar 2024
About Hindustan Zinc Ltd

Company Coordinates


