
Dashboard
Company has a low Debt to Equity ratio (avg) at 0 times
- PAT(Latest six months) At Rs 60.75 cr has Grown at 30.34%
- PBT LESS OI(Q) At Rs 43.60 cr has Grown at 56.3% (vs previous 4Q average)
- NET SALES(Q) Highest at Rs 180.52 cr
With ROE of 14.6, it has a Very Expensive valuation with a 2.8 Price to Book Value
Despite the size of the company, domestic mutual funds hold only 0% of the company
Market Beating performance in long term as well as near term
Total Returns (Price + Dividend) 
Latest dividend: 7.5 per share ex-dividend date: May-22-2025
Risk Adjusted Returns v/s
Returns Beta

News
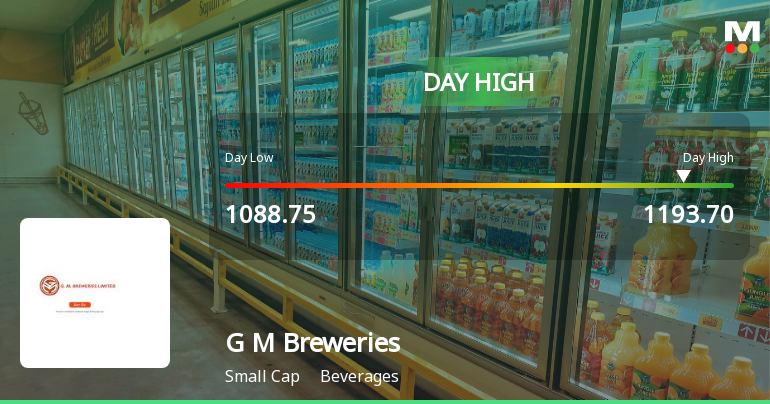
G M Breweries Hits Intraday High with Strong 7.4% Surge
G M Breweries demonstrated robust intraday performance on 26 Dec 2025, reaching a day’s high of Rs 1,193.7, marking a 7.41% rise from its previous close. This surge outpaced the broader Beverages sector and the Sensex, reflecting notable trading momentum despite a subdued market backdrop.
Read More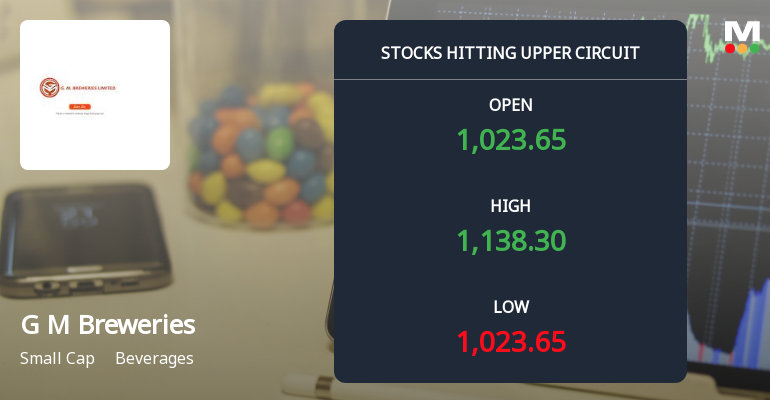
G M Breweries Hits Upper Circuit Amid Strong Buying Pressure and Robust Trading Activity
Shares of G M Breweries Ltd surged to hit the upper circuit limit on 24 Dec 2025, reflecting intense buying interest and a significant daily price gain. The stock outperformed its sector and broader market indices, supported by high trading volumes and a wide intraday price range, signalling robust investor participation and demand that remains largely unfilled due to regulatory price freeze mechanisms.
Read More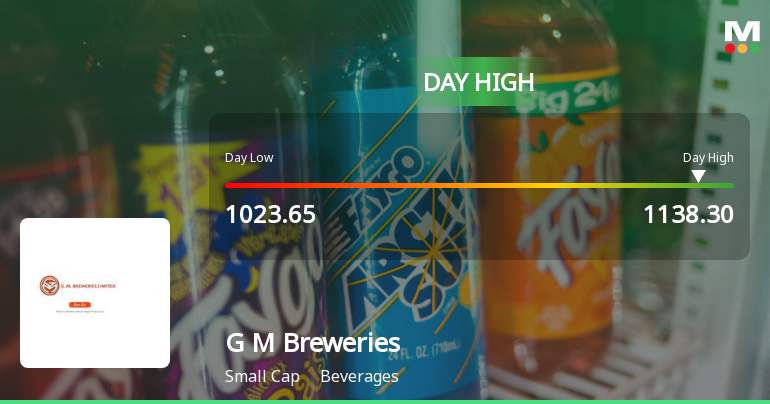
G M Breweries Hits Intraday High with Strong 9.87% Surge
G M Breweries demonstrated robust intraday performance on 24 Dec 2025, touching a day’s high of Rs 1,136.9, reflecting a 9.86% rise. The stock outpaced its sector and broader market indices, marking a notable trading session in the beverages sector.
Read More Announcements
Closure of Trading Window
23-Dec-2025 | Source : BSEClosure of Trading Window - Intimation
Board Meeting Intimation for Intimation Of Quarterly Un-Audited Financials Results For The Quarter Ended 31-12-2025
23-Dec-2025 | Source : BSEGM Breweries Ltdhas informed BSE that the meeting of the Board of Directors of the Company is scheduled on 06/01/2026 inter alia to consider and approve Intimation Of Quarterly Un-Audited Financials Results For the Quarter Ended 31-12-2025
Reconstitution Of Board Committees
12-Nov-2025 | Source : BSEReconstitution of Board Committees
Corporate Actions

06 Jan 2026

G M Breweries Ltd has declared 75% dividend, ex-date: 22 May 25

No Splits history available

G M Breweries Ltd has announced 1:4 bonus issue, ex-date: 24 May 24

No Rights history available
Quality key factors
Valuation key factors
Technicals key factors
 Technical Indicator Scale: Bearish, Mildly Bearish, Sideways, Mildly Bullish, Bullish Turned
 Shareholding Snapshot : Sep 2025
Shareholding Compare (%holding)
Promoters
None
Held by 0 Schemes
Held by 16 FIIs (0.38%)
Jimmy William Almeida Kashyap (61.76%)
None
21.29%
Quarterly Results Snapshot (Standalone) - Sep'25 - QoQ

QoQ Growth in quarter ended Sep 2025 is 10.84% vs -3.82% in Jun 2025
QoQ Growth in quarter ended Sep 2025 is 34.92% vs -57.23% in Jun 2025
Half Yearly Results Snapshot (Standalone) - Sep'25
Growth in half year ended Sep 2025 is 13.93% vs 1.00% in Sep 2024
Growth in half year ended Sep 2025 is 30.34% vs 10.24% in Sep 2024
Nine Monthly Results Snapshot (Standalone) - Dec'24

YoY Growth in nine months ended Dec 2024 is 2.60% vs 4.08% in Dec 2023
YoY Growth in nine months ended Dec 2024 is 5.70% vs 0.19% in Dec 2023
Annual Results Snapshot (Standalone) - Mar'25
YoY Growth in year ended Mar 2025 is 3.47% vs 3.66% in Mar 2024
YoY Growth in year ended Mar 2025 is -14.84% vs 51.72% in Mar 2024
About G M Breweries Ltd

Company Coordinates


