
Stock DNA
Financial Technology (Fintech)
INR 2,261 Cr (Small Cap)
28.00
23
0.00%
0.00
10.65%
2.96
Total Returns (Price + Dividend) 
Fino Payments for the last several years.
Risk Adjusted Returns v/s
Returns Beta

News

Fino Payments Sees Revision in Market Evaluation Amidst Flat Financial Trends
Fino Payments has experienced a revision in its market evaluation, reflecting shifts in its financial and technical outlook. The recent assessment highlights a combination of steady valuation appeal alongside subdued financial performance and sideways technical movement, prompting a reassessment of the stock’s standing within the financial technology sector.
Read More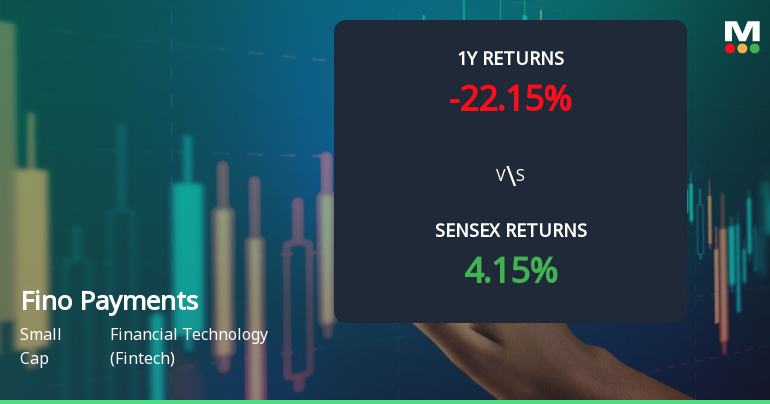
Fino Payments Bank Technical Momentum Shifts Amid Mixed Indicator Signals
Fino Payments Bank has experienced a notable shift in its technical momentum, moving from a mildly bullish stance to a sideways trend. This change is reflected across several key technical indicators, including the MACD, RSI, Bollinger Bands, and moving averages, signalling a complex market assessment for this fintech player.
Read More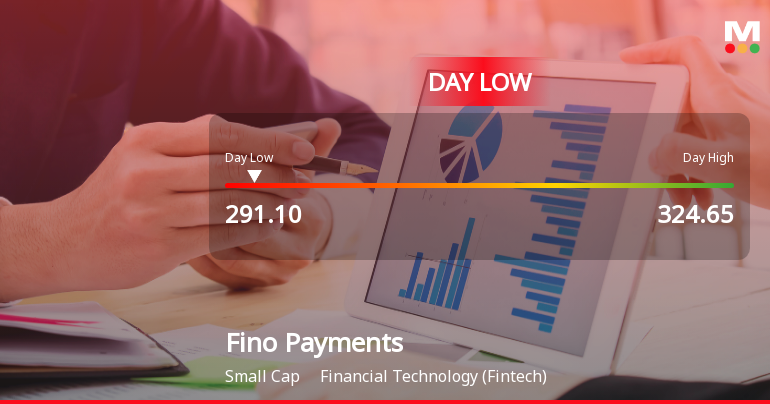
Fino Payments Bank Hits Intraday Low Amid Price Pressure and Market Volatility
Fino Payments Bank experienced a notable decline today, touching an intraday low of Rs 291.3, reflecting significant price pressure amid a volatile trading session. The stock underperformed its sector and the broader market, highlighting immediate challenges in sustaining earlier gains.
Read More Announcements
RBI Grants In-Principle Approval To Fino Payments Bank Limited For Conversion Into A Small Finance Bank
05-Dec-2025 | Source : BSERBIs in-principle approval for conversion from Payments Bank to Small Finance Bank.
Disclosure Under Regulation 30 Of SEBI Listing Regulation
20-Nov-2025 | Source : BSEDisclosure under Regulation 30 of SEBI Listing Regulation
Announcement under Regulation 30 (LODR)-Analyst / Investor Meet - Intimation
20-Nov-2025 | Source : BSEInvestors meet with One-up Financial Consultants Pvt Ltd on one to one basis
Corporate Actions

No Upcoming Board Meetings

No Dividend history available

No Splits history available

No Bonus history available

No Rights history available
Quality key factors
Valuation key factors
Technicals key factors
 Technical Indicator Scale: Bearish, Mildly Bearish, Sideways, Mildly Bullish, Bullish Turned
 Shareholding Snapshot : Sep 2025
Shareholding Compare (%holding)
Promoters
None
Held by 3 Schemes (2.65%)
Held by 28 FIIs (2.67%)
Fino Paytech Limited (75.0%)
Mirae Asset Banking And Financial Services Fund (1.81%)
14.65%
Quarterly Results Snapshot (Standalone) - Sep'25 - QoQ

QoQ Growth in quarter ended Sep 2025 is -1.44% vs 15.56% in Jun 2025

QoQ Growth in quarter ended Sep 2025 is -13.57% vs -26.00% in Jun 2025
Half Yearly Results Snapshot (Standalone) - Sep'25
Growth in half year ended Sep 2025 is 30.09% vs 33.98% in Sep 2024
Growth in half year ended Sep 2025 is -27.10% vs 18.84% in Sep 2024
Nine Monthly Results Snapshot (Standalone) - Dec'24
YoY Growth in nine months ended Dec 2024 is 31.12% vs 65.96% in Dec 2023
YoY Growth in nine months ended Dec 2024 is 12.31% vs 41.91% in Dec 2023
Annual Results Snapshot (Standalone) - Mar'25
YoY Growth in year ended Mar 2025 is 30.11% vs 58.18% in Mar 2024
YoY Growth in year ended Mar 2025 is 7.32% vs 32.48% in Mar 2024
About Fino Payments Bank Ltd

Company Coordinates


