
Dashboard
Flat results in Sep 25
- NET SALES(Q) At Rs 227.35 cr has Fallen at -16.9% (vs previous 4Q average)
- PBT LESS OI(Q) At Rs 52.59 cr has Fallen at -7.2% (vs previous 4Q average)
With ROE of 18.2, it has a Expensive valuation with a 3.2 Price to Book Value
Falling Participation by Institutional Investors
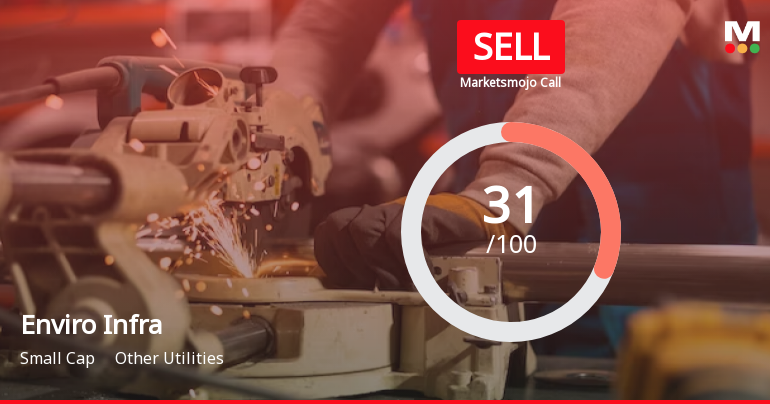
Below par performance in long term as well as near term
Stock DNA
Other Utilities
INR 3,654 Cr (Small Cap)
18.00
33
0.00%
-0.11
18.19%
3.17
Total Returns (Price + Dividend) 
Enviro Infra for the last several years.
Risk Adjusted Returns v/s
Returns Beta

News
Enviro Infra’s Evaluation Revised Amidst Challenging Market and Financial Trends
Enviro Infra has experienced a revision in its market evaluation, reflecting shifts in its financial performance, valuation, and technical outlook. This reassessment comes amid a backdrop of subdued sales, flat profit trends, and a challenging market environment for the Other Utilities sector.
Read More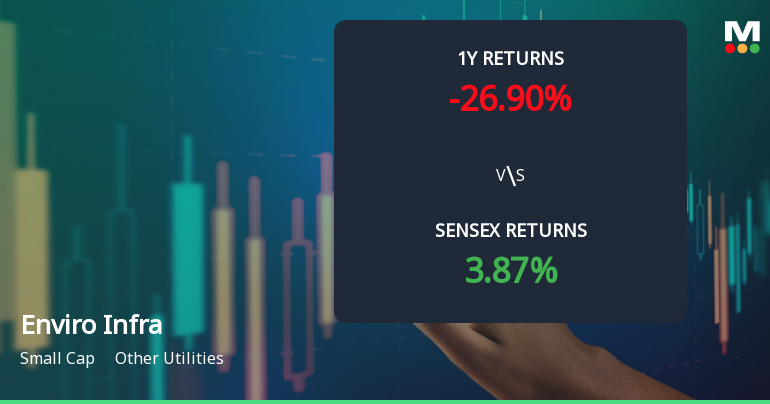
Enviro Infra Engineers Faces Bearish Momentum Amid Technical Shifts
Enviro Infra Engineers, a player in the Other Utilities sector, is currently exhibiting a shift in price momentum and technical indicators that suggest a bearish trend. Recent market data and technical analysis reveal a complex picture of the stock’s performance, with key indicators signalling caution for investors amid a challenging market environment.
Read More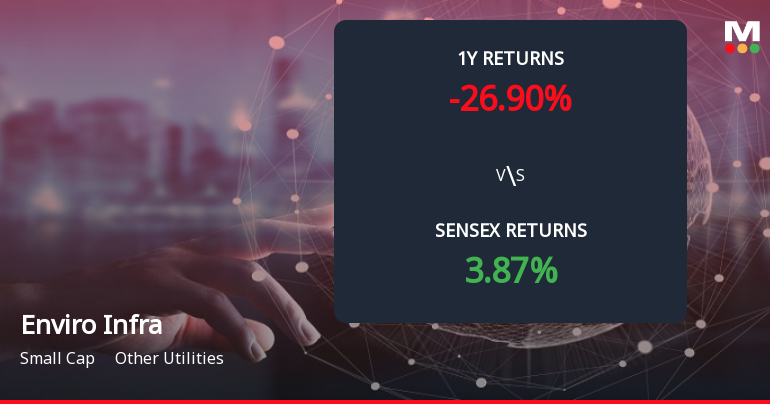
Enviro Infra Engineers Forms Death Cross Signalling Potential Bearish Trend
Enviro Infra Engineers, a player in the Other Utilities sector, has recently formed a Death Cross, a technical pattern where the 50-day moving average crosses below the 200-day moving average. This development is widely regarded as a bearish indicator, suggesting a possible shift towards a prolonged downtrend and signalling caution for investors monitoring the stock’s momentum.
Read More Announcements
Intimation Of Drop/Closure Of GST Proceedings Against The Company
22-Dec-2025 | Source : BSEIntimation of Drop/Closure of GST Proceedings against the Company.
Intimation Of Drop/Closure Of GST Proceedings Against The Company
19-Dec-2025 | Source : BSEIntimation of Drop/Closure of GST Proceedings against the Company.
Announcement under Regulation 30 (LODR)-Analyst / Investor Meet - Intimation
13-Dec-2025 | Source : BSEAnalyst/Investor Meet on 17.12.2025
Corporate Actions

No Upcoming Board Meetings

No Dividend history available

No Splits history available

No Bonus history available

No Rights history available
Quality key factors
Valuation key factors
Technicals key factors
 Technical Indicator Scale: Bearish, Mildly Bearish, Sideways, Mildly Bullish, Bullish Turned
 Shareholding Snapshot : Sep 2025
Shareholding Compare (%holding)
Promoters
None
Held by 6 Schemes (0.1%)
Held by 12 FIIs (0.42%)
Sanjay Jain (27.88%)
None
24.23%
Quarterly Results Snapshot (Consolidated) - Sep'25 - QoQ

QoQ Growth in quarter ended Sep 2025 is -5.63% vs -38.68% in Jun 2025
QoQ Growth in quarter ended Sep 2025 is 16.28% vs -42.79% in Jun 2025
Half Yearly Results Snapshot (Consolidated) - Sep'25

Growth in half year ended Sep 2025 is 11.98% vs 50.09% in Sep 2024
Growth in half year ended Sep 2025 is 36.54% vs 101.40% in Sep 2024
Nine Monthly Results Snapshot (Standalone) - Dec'24
Not Applicable: The company has declared_date for only one period
Not Applicable: The company has declared_date for only one period
Annual Results Snapshot (Standalone) - Mar'25
Not Applicable: The company has declared_date for only one period
Not Applicable: The company has declared_date for only one period
About Enviro Infra Engineers Ltd

Company Coordinates


