
Stock DNA
Industrial Manufacturing
INR 3,385 Cr (Small Cap)
41.00
54
0.00%
-0.10
8.28%
3.42
Total Returns (Price + Dividend) 
Cyient DLM for the last several years.
Risk Adjusted Returns v/s
Returns Beta

News
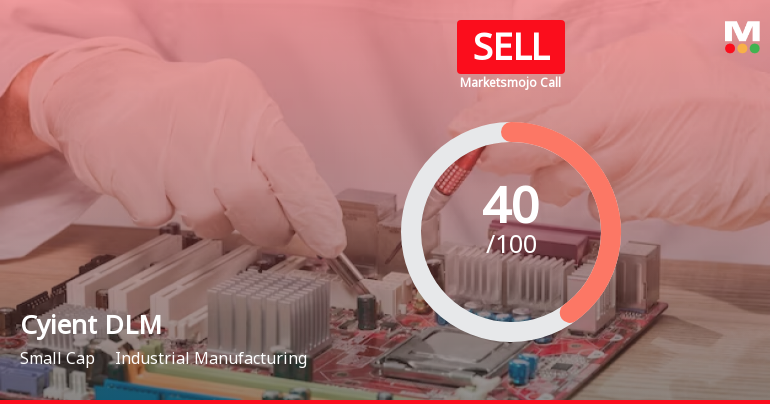
Cyient DLM Sees Revision in Market Evaluation Amidst Challenging Performance
Cyient DLM has experienced a revision in its market evaluation reflecting shifts in key analytical parameters. The company’s recent assessment highlights a complex interplay of factors across quality, valuation, financial trends, and technical outlook, set against a backdrop of subdued stock returns and sector dynamics.
Read More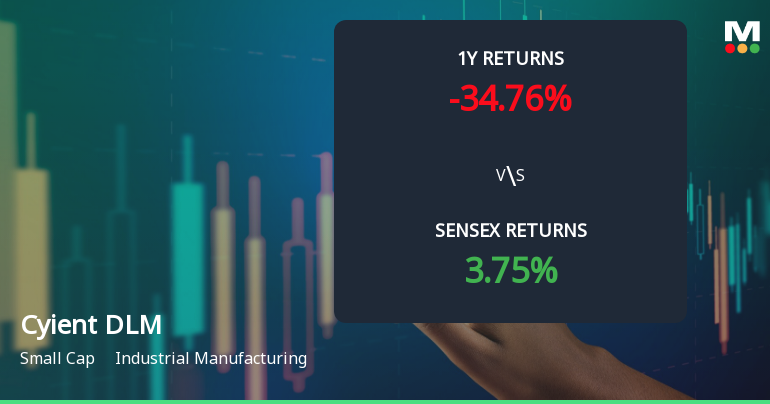
Cyient DLM Technical Momentum Shifts Amid Bearish Signals
Cyient DLM, a key player in the industrial manufacturing sector, is exhibiting a notable shift in its technical momentum as recent evaluation adjustments reflect a transition towards bearish trends. Despite a modest uptick in the stock price to ₹428.85, the broader technical indicators suggest a cautious outlook for investors navigating this evolving landscape.
Read More
Cyient DLM Technical Momentum Shifts Amidst Market Challenges
Cyient DLM, a key player in the Industrial Manufacturing sector, has experienced notable shifts in its technical momentum, reflecting a complex market environment. Recent evaluation adjustments reveal a transition in price dynamics and technical indicators, underscoring the challenges faced by the stock amid broader market trends.
Read More Announcements
Announcement under Regulation 30 (LODR)-Newspaper Publication
15-Dec-2025 | Source : BSEPlease find enclosed copy of newspaper publication.
Shareholder Meeting / Postal Ballot-Notice of Postal Ballot
12-Dec-2025 | Source : BSEPlease find enclosed Notice of Postal Ballot
Announcement under Regulation 30 (LODR)-Change in Management
26-Nov-2025 | Source : BSEIntimation of appointment of Mr. Giridhar Aramane as Non-Executive Independent Director of the Company for a term of three years.
Corporate Actions

No Upcoming Board Meetings

No Dividend history available

No Splits history available

No Bonus history available

No Rights history available
Quality key factors
Valuation key factors
Technicals key factors
 Technical Indicator Scale: Bearish, Mildly Bearish, Sideways, Mildly Bullish, Bullish Turned
 Shareholding Snapshot : Sep 2025
Shareholding Compare (%holding)
Promoters
None
Held by 14 Schemes (28.06%)
Held by 38 FIIs (2.19%)
Cyient Limited (52.12%)
Hdfc Mutual Fund - Hdfc Defence Fund (9.72%)
14.86%
Quarterly Results Snapshot (Consolidated) - Sep'25 - QoQ

QoQ Growth in quarter ended Sep 2025 is 11.56% vs -34.96% in Jun 2025
QoQ Growth in quarter ended Sep 2025 is 330.97% vs -75.97% in Jun 2025
Half Yearly Results Snapshot (Consolidated) - Sep'25

Growth in half year ended Sep 2025 is -9.00% vs 27.18% in Sep 2024
Growth in half year ended Sep 2025 is 52.05% vs 30.18% in Sep 2024
Nine Monthly Results Snapshot (Standalone) - Dec'24
YoY Growth in nine months ended Dec 2024 is 21.04% vs 49.64% in Dec 2023
YoY Growth in nine months ended Dec 2024 is 8.71% vs 100.89% in Dec 2023
Annual Results Snapshot (Consolidated) - Mar'25
YoY Growth in year ended Mar 2025 is 27.50% vs 43.25% in Mar 2024
YoY Growth in year ended Mar 2025 is 11.24% vs 92.88% in Mar 2024
About Cyient DLM Ltd

Company Coordinates


