
Stock DNA
Garments & Apparels
INR 962 Cr (Micro Cap)
17.00
22
2.27%
-0.23
4.07%
0.67
Total Returns (Price + Dividend) 
Latest dividend: 10 per share ex-dividend date: Aug-05-2025
Risk Adjusted Returns v/s
Returns Beta

News

Century Enka’s Evaluation Revised Amidst Challenging Market Conditions
Century Enka has experienced a revision in its market evaluation, reflecting adjustments in key analytical parameters amid subdued financial performance and sector pressures. This shift highlights the evolving assessment of the company’s prospects within the Garments & Apparels sector.
Read More
Century Enka Falls to 52-Week Low of Rs.408.1 Amidst Prolonged Downtrend
Century Enka’s stock price reached a fresh 52-week low of Rs.408.1 today, marking a significant milestone in its ongoing downward trajectory. The stock’s performance over the past year has lagged notably behind broader market indices, reflecting a combination of subdued sales growth and declining profitability within the garments and apparels sector.
Read More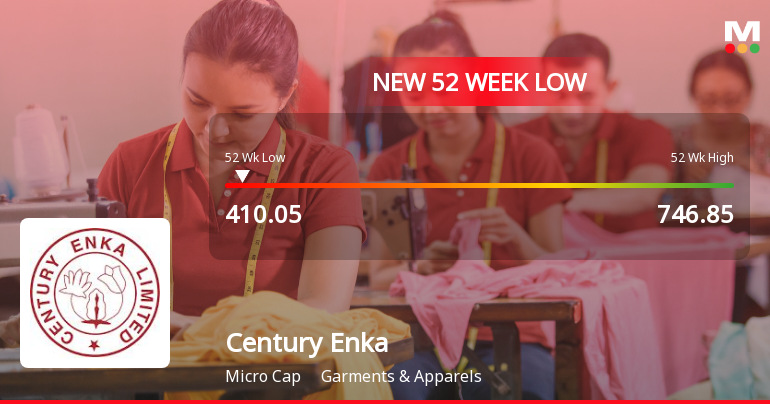
Century Enka Falls to 52-Week Low of Rs.410.05 Amidst Continued Downtrend
Century Enka's stock price reached a fresh 52-week low of Rs.410.05 today, marking a significant decline amid ongoing downward momentum. The stock has underperformed its sector and broader market indices, reflecting challenges in both long-term growth and recent quarterly results.
Read More Announcements
Closure of Trading Window
24-Dec-2025 | Source : BSEIntimation of Closure of Trading Window attached.
ESG Rating Of Century Enka Limited By CFC Finlease Private Limited
14-Nov-2025 | Source : BSEVoluntarily assigned ESG rating by CFC Finlease Pvt. Ltd.
Announcement under Regulation 30 (LODR)-Earnings Call Transcript
13-Nov-2025 | Source : BSETranscript of Q2 and H1 FY 26 Earnings Conference Call attached.
Corporate Actions

No Upcoming Board Meetings

Century Enka Ltd has declared 100% dividend, ex-date: 05 Aug 25

No Splits history available

No Bonus history available

No Rights history available
Quality key factors
Valuation key factors
Technicals key factors
 Technical Indicator Scale: Bearish, Mildly Bearish, Sideways, Mildly Bullish, Bullish Turned
 Shareholding Snapshot : Sep 2025
Shareholding Compare (%holding)
Non Institution
None
Held by 6 Schemes (9.72%)
Held by 39 FIIs (2.1%)
Birla Group Holdings Private Limited (16.63%)
Quant Mutual Fund - Quant Multi Cap Fund (7.87%)
44.67%
Quarterly Results Snapshot (Consolidated) - Sep'25 - QoQ

QoQ Growth in quarter ended Sep 2025 is 1.79% vs -9.57% in Jun 2025

QoQ Growth in quarter ended Sep 2025 is 45.19% vs 127.51% in Jun 2025
Half Yearly Results Snapshot (Consolidated) - Sep'25
Growth in half year ended Sep 2025 is -23.87% vs 29.02% in Sep 2024
Growth in half year ended Sep 2025 is -17.52% vs 156.71% in Sep 2024
Nine Monthly Results Snapshot (Consolidated) - Dec'24
YoY Growth in nine months ended Dec 2024 is 22.13% vs -20.25% in Dec 2023
YoY Growth in nine months ended Dec 2024 is 165.61% vs -70.35% in Dec 2023
Annual Results Snapshot (Consolidated) - Mar'25
YoY Growth in year ended Mar 2025 is 14.77% vs -15.82% in Mar 2024
YoY Growth in year ended Mar 2025 is 55.49% vs -52.67% in Mar 2024
About Century Enka Ltd

Company Coordinates


