
Dashboard
Weak Long Term Fundamental Strength with a 5.86% CAGR growth in Operating Profits over the last 5 years
- Low ability to service debt as the company has a high Debt to EBITDA ratio of 4.14 times
Positive results in Sep 25
With ROCE of 13.1, it has a Attractive valuation with a 2.3 Enterprise value to Capital Employed
Majority shareholders : Promoters
Underperformed the market in the last 1 year
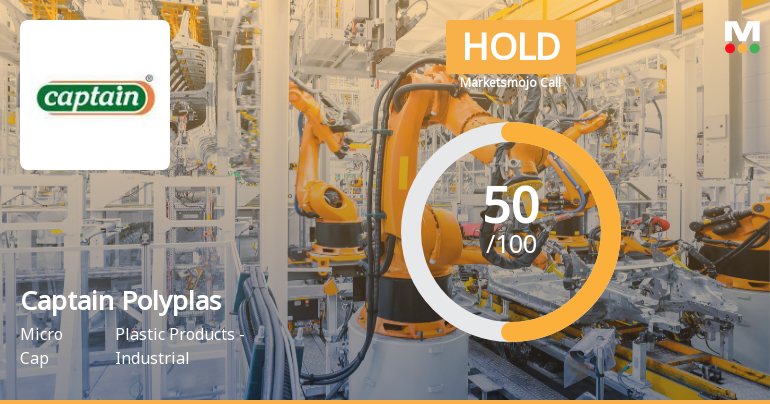
Stock DNA
Plastic Products - Industrial
INR 497 Cr (Micro Cap)
24.00
37
0.00%
0.48
11.94%
2.91
Total Returns (Price + Dividend) 
Latest dividend: 0.04 per share ex-dividend date: Sep-21-2021
Risk Adjusted Returns v/s
Returns Beta

News
Captain Polyplast Sees Shift in Market Assessment Amid Mixed Financial and Technical Signals
Captain Polyplast, a player in the Plastic Products - Industrial sector, has experienced a notable revision in its market evaluation following recent developments across financial performance, valuation metrics, and technical indicators. This article analyses the key factors influencing the current market perspective on the stock.
Read More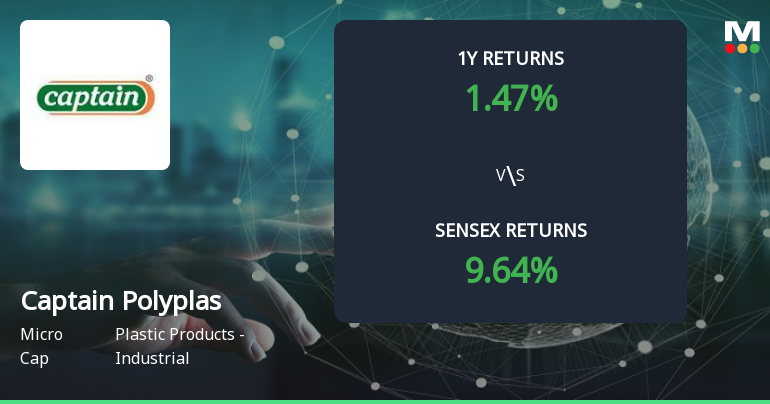
Captain Polyplast Forms Golden Cross, Signalling Potential Bullish Breakout
Captain Polyplast, a key player in the Plastic Products - Industrial sector, has recently formed a Golden Cross, a significant technical indicator that often signals a potential bullish breakout and a shift in long-term market momentum.
Read More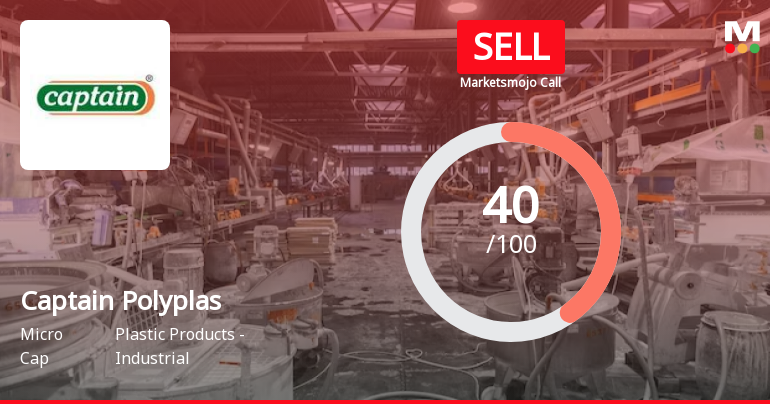
Captain Polyplas Sees Revision in Market Evaluation Amid Mixed Financial Signals
Captain Polyplas, a microcap player in the Plastic Products - Industrial sector, has experienced a revision in its market evaluation reflecting nuanced shifts across its financial and technical parameters. This development comes amid a backdrop of mixed performance indicators and evolving investor sentiment.
Read More Announcements
Announcement under Regulation 30 (LODR)-Award_of_Order_Receipt_of_Order
24-Dec-2025 | Source : BSEcompany has received order worth Rs.27.69 crores from MAHARASHTRA STATE ELECTRICITY DISTRIBUTION COMPANY LIMITED for 1000 SPWPS. PRESS RELEASE FOR THE SAME IS ATTACHED HEREWITH
Outcome Of Investor Meet
17-Dec-2025 | Source : BSEas attached
Announcement under Regulation 30 (LODR)-Analyst / Investor Meet - Intimation
11-Dec-2025 | Source : BSEATTACHED HEREWITH DETAILS OF INVESTOR MEET AND LINK FOR REGISTRATION
Corporate Actions

No Upcoming Board Meetings

Captain Polyplast Ltd has declared 2% dividend, ex-date: 21 Sep 21

Captain Polyplast Ltd has announced 2:10 stock split, ex-date: 19 Sep 18

Captain Polyplast Ltd has announced 1:8 bonus issue, ex-date: 08 Oct 15

No Rights history available
Quality key factors
Valuation key factors
Technicals key factors
 Technical Indicator Scale: Bearish, Mildly Bearish, Sideways, Mildly Bullish, Bullish Turned
 Shareholding Snapshot : Sep 2025
Shareholding Compare (%holding)
Promoters
14.5099
Held by 0 Schemes
Held by 0 FIIs
Rameshbhai Devrajbhai Khichadia (15.48%)
Polymer Impex Private Ltd (1.05%)
26.75%
Quarterly Results Snapshot (Consolidated) - Sep'25 - YoY

YoY Growth in quarter ended Sep 2025 is 49.70% vs -24.27% in Sep 2024

YoY Growth in quarter ended Sep 2025 is -73.94% vs 372.97% in Sep 2024
Half Yearly Results Snapshot (Consolidated) - Sep'25
Growth in half year ended Sep 2025 is 26.51% vs -17.35% in Sep 2024
Growth in half year ended Sep 2025 is -56.16% vs 149.74% in Sep 2024
Nine Monthly Results Snapshot (Consolidated) - Dec'24
YoY Growth in nine months ended Dec 2024 is -7.61% vs 52.53% in Dec 2023
YoY Growth in nine months ended Dec 2024 is 105.25% vs 329.97% in Dec 2023
Annual Results Snapshot (Consolidated) - Mar'25
YoY Growth in year ended Mar 2025 is -2.54% vs 31.04% in Mar 2024
YoY Growth in year ended Mar 2025 is 76.15% vs 194.86% in Mar 2024
About Captain Polyplast Ltd

Company Coordinates


