
Stock DNA
Software Products
INR 1,086 Cr (Micro Cap)
21.00
29
0.00%
0.54
33.12%
6.93
Total Returns (Price + Dividend) 
Latest dividend: 0.02 per share ex-dividend date: Oct-11-2024
Risk Adjusted Returns v/s
Returns Beta

News

Blue Cloud Softech Solutions: Technical Momentum Shift Signals Mixed Outlook
Blue Cloud Softech Solutions has exhibited a notable shift in its technical momentum, reflecting a nuanced market assessment amid fluctuating price dynamics. Recent evaluation adjustments highlight a transition from a predominantly bearish stance to a more mildly bearish technical trend, underscoring a complex interplay of momentum indicators and moving averages that investors should carefully consider.
Read More
Blue Cloud Soft. Sees Revision in Market Evaluation Amidst Challenging Returns
Blue Cloud Soft., a microcap player in the Software Products sector, has experienced a revision in its market evaluation reflecting shifts in its fundamental and technical outlook. This adjustment comes amid a backdrop of significant underperformance relative to broader market indices over the past year.
Read More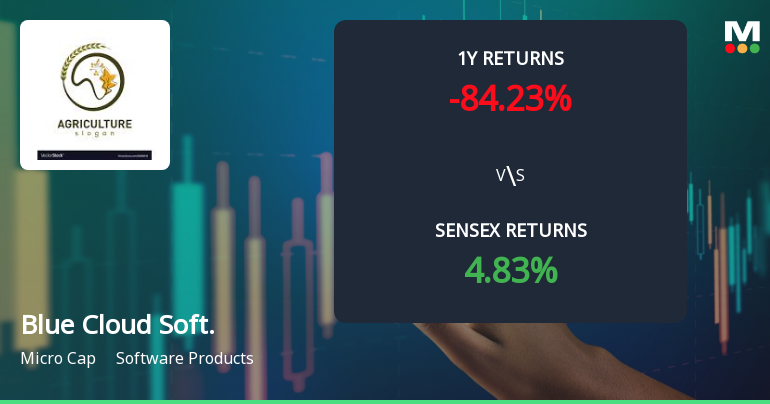
Blue Cloud Softech Solutions Faces Technical Momentum Shift Amid Market Challenges
Blue Cloud Softech Solutions, a player in the software products sector, has experienced a notable shift in its technical momentum, reflecting evolving market dynamics and investor sentiment. Recent technical indicators reveal a complex picture of price movement and momentum, underscoring the challenges faced by the company amid broader market trends.
Read More Announcements
Announcement under Regulation 30 (LODR)-Press Release / Media Release
24-Dec-2025 | Source : BSEBlue Cloud Softech Solutions Ltd (BCSSL) Signs Semiconductor Development MoU with ConnectM Technology Solutions Pvt Ltd for EdgeAI System-on-Chip (SoC) for Next-Generation Automotive Cybersecurity.
Announcement under Regulation 30 (LODR)-Press Release / Media Release
22-Dec-2025 | Source : BSEBlue Cloud Softech Solutions Ltd in collaboration with Orange pioneers Indias first enterprise grade BSNL 5G FWA deployment leveraging Broadband Network Gateway (BNG) architecture at Mindi Exchange Visakhapatnam
Announcement under Regulation 30 (LODR)-Press Release / Media Release
17-Dec-2025 | Source : BSEBlue Cloud Softech Solutions Ltd announces its Empanelment as Official BSNL Partner for 5G Fixed Wireless Access (FWA) for Maharashtra and GOA Circle.
Corporate Actions

No Upcoming Board Meetings

Blue Cloud Softech Solutions Ltd has declared 1% dividend, ex-date: 11 Oct 24

Blue Cloud Softech Solutions Ltd has announced 1:2 stock split, ex-date: 20 Jan 25

No Bonus history available

No Rights history available
Quality key factors
Valuation key factors
Technicals key factors
 Technical Indicator Scale: Bearish, Mildly Bearish, Sideways, Mildly Bullish, Bullish Turned
 Shareholding Snapshot : Sep 2025
Shareholding Compare (%holding)
Non Institution
None
Held by 0 Schemes
Held by 2 FIIs (22.94%)
Yarlagadda Janaki (33.37%)
Yas Takaful P J S C (22.93%)
14.04%
Quarterly Results Snapshot (Consolidated) - Sep'25 - QoQ

QoQ Growth in quarter ended Sep 2025 is 22.75% vs 12.22% in Jun 2025

QoQ Growth in quarter ended Sep 2025 is 7.16% vs 10.35% in Jun 2025
Half Yearly Results Snapshot (Consolidated) - Sep'25
Growth in half year ended Sep 2025 is -1.62% vs 284.37% in Sep 2024
Growth in half year ended Sep 2025 is 36.56% vs 536.44% in Sep 2024
Nine Monthly Results Snapshot (Standalone) - Dec'24
YoY Growth in nine months ended Dec 2024 is 173.99% vs 25,822.00% in Dec 2023
YoY Growth in nine months ended Dec 2024 is 910.84% vs 8,200.00% in Dec 2023
Annual Results Snapshot (Standalone) - Mar'25
YoY Growth in year ended Mar 2025 is 145.64% vs 603.79% in Mar 2024
YoY Growth in year ended Mar 2025 is 538.68% vs 769.70% in Mar 2024
About Blue Cloud Softech Solutions Ltd

Company Coordinates


