
Stock DNA
Aerospace & Defense
INR 55,329 Cr (Mid Cap)
83.00
44
0.31%
-0.99
15.51%
12.88
Total Returns (Price + Dividend) 
Latest dividend: 0.65 per share ex-dividend date: Sep-19-2025
Risk Adjusted Returns v/s
Returns Beta

News

Bharat Dynamics Sees Robust Call Option Activity Ahead of December Expiry
Bharat Dynamics Ltd has emerged as a focal point in the options market with significant call option trading activity observed ahead of the 30 December 2025 expiry. The aerospace and defence company’s stock has demonstrated notable price momentum, supported by active investor participation and a surge in call contracts at key strike prices, signalling a bullish sentiment among market participants.
Read More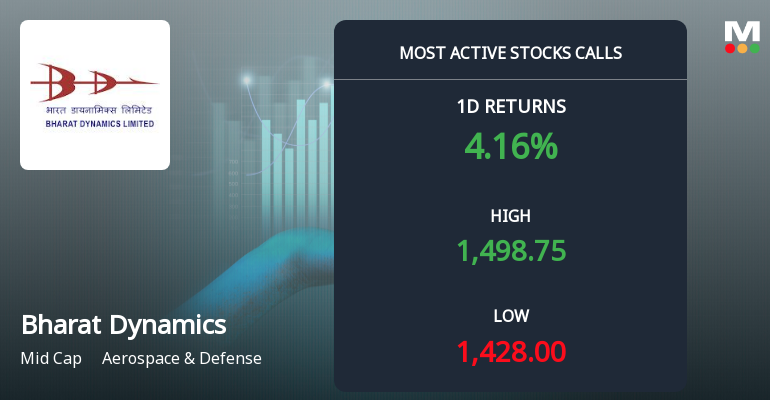
Bharat Dynamics Sees Heavy Call Option Activity Amid Bullish Market Momentum
Bharat Dynamics Ltd has emerged as one of the most actively traded stocks in the call options segment, reflecting notable investor interest ahead of the 30 December 2025 expiry. The aerospace and defence company’s shares have demonstrated consistent gains over the past week, supported by substantial call option volumes at the ₹1,500 strike price, signalling a bullish positioning among market participants.
Read More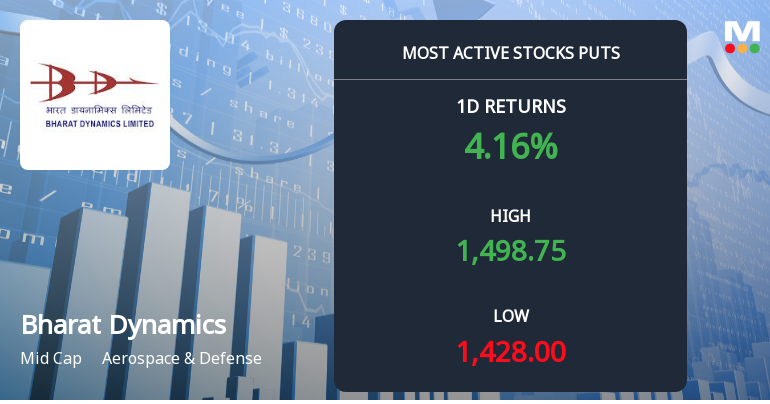
Bharat Dynamics Sees Heavy Put Option Activity Ahead of December Expiry
Bharat Dynamics Ltd, a key player in the Aerospace & Defense sector, has attracted significant attention in the options market with a surge in put option trading ahead of the 30 December 2025 expiry. The stock’s recent price movements and option activity suggest a complex interplay of hedging and bearish positioning among investors.
Read More Announcements
Announcement under Regulation 30 (LODR)-Change in Management
01-Dec-2025 | Source : BSEChange in Senior Management Personnel.
Announcement under Regulation 30 (LODR)-Award_of_Order_Receipt_of_Order
01-Dec-2025 | Source : BSEReceipt of order
Announcement Under Regulation 30
28-Nov-2025 | Source : BSEIntimation of Stock Exchange fine imposition
Corporate Actions

No Upcoming Board Meetings

Bharat Dynamics Ltd has declared 13% dividend, ex-date: 19 Sep 25

Bharat Dynamics Ltd has announced 5:10 stock split, ex-date: 24 May 24

No Bonus history available

No Rights history available
Quality key factors
Valuation key factors
Technicals key factors
 Technical Indicator Scale: Bearish, Mildly Bearish, Sideways, Mildly Bullish, Bullish Turned
 Shareholding Snapshot : Sep 2025
Shareholding Compare (%holding)
Promoters
None
Held by 31 Schemes (5.79%)
Held by 105 FIIs (2.43%)
President Of India (74.93%)
Life Insurance Corporation Of India (1.87%)
10.01%
Quarterly Results Snapshot (Standalone) - Sep'25 - YoY

YoY Growth in quarter ended Sep 2025 is 114.22% vs -12.22% in Sep 2024
YoY Growth in quarter ended Sep 2025 is 76.19% vs -16.70% in Sep 2024
Half Yearly Results Snapshot (Standalone) - Sep'25
Growth in half year ended Sep 2025 is 90.56% vs -20.14% in Sep 2024
Growth in half year ended Sep 2025 is 80.52% vs -31.32% in Sep 2024
Nine Monthly Results Snapshot (Standalone) - Dec'24
YoY Growth in nine months ended Dec 2024 is 1.37% vs -10.18% in Dec 2023

YoY Growth in nine months ended Dec 2024 is -14.53% vs 62.45% in Dec 2023
Annual Results Snapshot (Standalone) - Mar'25
YoY Growth in year ended Mar 2025 is 41.37% vs -4.80% in Mar 2024
YoY Growth in year ended Mar 2025 is -10.29% vs 73.98% in Mar 2024
About Bharat Dynamics Ltd

Company Coordinates


