
Stock DNA
Specialty Chemicals
INR 16,946 Cr (Small Cap)
44.00
31
0.51%
-0.01
10.02%
4.44
Total Returns (Price + Dividend) 
Latest dividend: 20 per share ex-dividend date: Jul-30-2025
Risk Adjusted Returns v/s
Returns Beta

News

BASF India Sees Revision in Market Assessment Amidst Challenging Trends
BASF India has experienced a revision in its market evaluation, reflecting shifts in key analytical parameters that influence investor sentiment. The specialty chemicals company’s recent assessment highlights a complex interplay of strengths and weaknesses across quality, valuation, financial trends, and technical outlook, set against a backdrop of subdued stock performance and sector dynamics.
Read More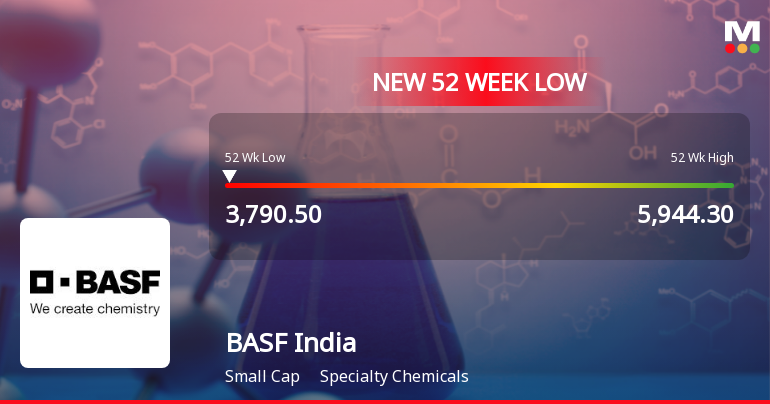
BASF India Stock Falls to 52-Week Low of Rs.3802.65 Amidst Sector Pressure
BASF India has reached a new 52-week low of Rs.3802.65, marking a significant price level for the specialty chemicals company as it continues to trade below key moving averages amid a subdued market environment.
Read More
BASF India Stock Falls to 52-Week Low of Rs.3855.25 Amidst Sector Pressure
BASF India’s share price touched a fresh 52-week low of Rs.3855.25 today, marking a significant decline amid a broader sectoral downturn. The stock has been trading below all major moving averages and has recorded a consecutive two-day fall, reflecting ongoing pressures within the specialty chemicals industry.
Read More Announcements
Closure of Trading Window
23-Dec-2025 | Source : BSEIntimation of closure of Trading Window for the purpose of unaudited standalone and consolidated financial results of the Company for the quarter ending 31st December 2025
Board Meeting Intimation for Unaudited Standalone And Consolidated Financial Results Of The Company For The Quarter Ending 31St December 2025
23-Dec-2025 | Source : BSEBASF India Ltdhas informed BSE that the meeting of the Board of Directors of the Company is scheduled on 13/02/2026 inter alia to consider and approve Unaudited Standalone and Consolidated Financial Results of the Company for the Quarter ending 31st December 2025
Announcement under Regulation 30 (LODR)-Newspaper Publication
27-Nov-2025 | Source : BSENewspaper Advertisement for Notice of Postal Ballot and Remote E - Voting facility to the members
Corporate Actions

13 Feb 2026

BASF India Ltd has declared 200% dividend, ex-date: 30 Jul 25

No Splits history available

No Bonus history available

No Rights history available
Quality key factors
Valuation key factors
Technicals key factors
 Technical Indicator Scale: Bearish, Mildly Bearish, Sideways, Mildly Bullish, Bullish Turned
 Shareholding Snapshot : Sep 2025
Shareholding Compare (%holding)
Promoters
None
Held by 21 Schemes (3.41%)
Held by 119 FIIs (4.14%)
Basf Societas Europaea (52.75%)
Tata Mutual Fund - Tata Small Cap Fund (2.37%)
11.47%
Quarterly Results Snapshot (Standalone) - Sep'25 - YoY

YoY Growth in quarter ended Sep 2025 is -8.09% vs 14.65% in Sep 2024
YoY Growth in quarter ended Sep 2025 is -21.02% vs -14.19% in Sep 2024
Half Yearly Results Snapshot (Consolidated) - Sep'25
Not Applicable: The company has declared_date for only one period
Not Applicable: The company has declared_date for only one period
Nine Monthly Results Snapshot (Consolidated) - Dec'24
Not Applicable: The company has declared_date for only one period
Not Applicable: The company has declared_date for only one period
Annual Results Snapshot (Consolidated) - Mar'25
YoY Growth in year ended Mar 2025 is 10.84% vs 81.28% in Mar 2024
YoY Growth in year ended Mar 2025 is -14.95% vs 2,364.00% in Mar 2024
About BASF India Ltd

Company Coordinates


