
Dashboard
Poor Management Efficiency with a low ROCE of 9.59%
- The company has been able to generate a Return on Capital Employed (avg) of 9.59% signifying low profitability per unit of total capital (equity and debt)
- PBT LESS OI(Q) At Rs -63.40 cr has Fallen at -1194.99%
- PAT(Q) At Rs -32.86 cr has Fallen at -271.1%
- OPERATING PROFIT TO INTEREST (Q) Lowest at 1.19 times
With ROCE of 10.1, it has a Expensive valuation with a 4.6 Enterprise value to Capital Employed
Stock DNA
Electronics & Appliances
INR 23,088 Cr (Small Cap)
104.00
59
0.00%
0.50
6.11%
6.28
Total Returns (Price + Dividend) 
Latest dividend: 1.6 per share ex-dividend date: Mar-26-2020
Risk Adjusted Returns v/s
Returns Beta

News

Amber Enterprises India Sees Shift in Technical Momentum Amid Mixed Indicator Signals
Amber Enterprises India has experienced a notable shift in its technical momentum, moving from a sideways trend to a mildly bearish stance. This change is underscored by a complex interplay of technical indicators, including the MACD, RSI, Bollinger Bands, and moving averages, which collectively paint a nuanced picture of the stock’s near-term outlook within the Electronics & Appliances sector.
Read More
Amber Enterprises India: Analytical Perspective Shifts Amid Mixed Financial and Technical Signals
Amber Enterprises India has experienced a revision in its market assessment, reflecting nuanced changes across quality, valuation, financial trends, and technical indicators. This article explores the underlying factors influencing the recent analytical perspective shifts, providing investors with a comprehensive understanding of the company’s current standing within the Electronics & Appliances sector.
Read More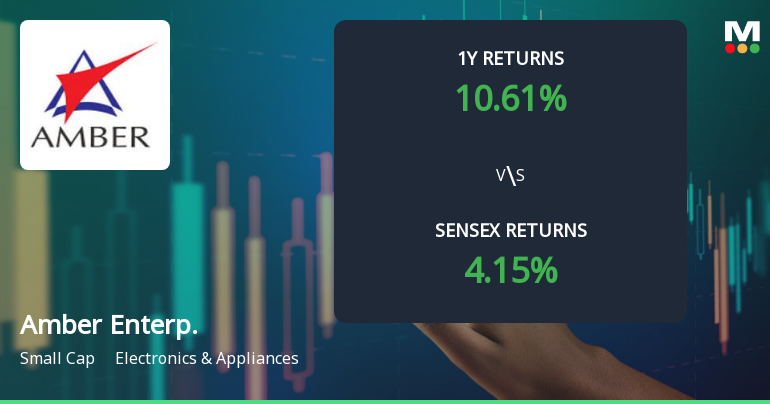
Amber Enterprises India: Technical Momentum Shifts Amid Mixed Market Signals
Amber Enterprises India has experienced a notable shift in its technical momentum, reflecting a complex interplay of market forces and indicator signals. Recent assessment changes reveal a transition from a mildly bearish trend to a sideways movement, underscoring a period of consolidation for the electronics and appliances sector player.
Read More Announcements
Announcement under Regulation 30 (LODR)-Analyst / Investor Meet - Intimation
09-Dec-2025 | Source : BSEPursuant to relevant provisions of SEBI LODR Regulations we are hereby informing the exchange that the officials of the Company will be interacting with the Analysts/Investors on 12th December 2025 from 10:00 A.M. IST onwards in Mumbai.
Announcement under Regulation 30 (LODR)-Updates on Acquisition
01-Dec-2025 | Source : BSEPursuant to Regulation 30 of SEBI LODR Regulations we are hereby informing the exchange that IL JIN Electronics (India) Private Limited a material subsidiary of the Company has completed the acquisition of 80% stake in the equity share capital of the Shogini Technoarts Pvt Ltd.
Announcement under Regulation 30 (LODR)-Updates on Acquisition
24-Nov-2025 | Source : BSEPursuant to Regulation 30 of SEBI LODR Regulations we hereby inform the exchange that IL JIN Electronics (India) Private Limited (ILJIN) a material subsidiary of the Company has further indirectly acquired 0.96% stake in the equity share capital of Unitronics (1989) (RG) Ltd. through ILJIN Holding Ltd its Israel based wholly owned subsidiary of ILJIN.
Corporate Actions

No Upcoming Board Meetings

Amber Enterprises India Ltd has declared 16% dividend, ex-date: 26 Mar 20

No Splits history available

No Bonus history available

No Rights history available
Quality key factors
Valuation key factors
Technicals key factors
 Technical Indicator Scale: Bearish, Mildly Bearish, Sideways, Mildly Bullish, Bullish Turned
 Shareholding Snapshot : Sep 2025
Shareholding Compare (%holding)
Promoters
None
Held by 30 Schemes (15.59%)
Held by 323 FIIs (30.6%)
Jasbir Singh (20.08%)
Motilal Oswal Focused Fund (2.74%)
9.38%
Quarterly Results Snapshot (Consolidated) - Sep'25 - YoY

YoY Growth in quarter ended Sep 2025 is -2.24% vs 81.73% in Sep 2024
YoY Growth in quarter ended Sep 2025 is -271.15% vs 376.26% in Sep 2024
Half Yearly Results Snapshot (Consolidated) - Sep'25
Growth in half year ended Sep 2025 is 24.72% vs 55.42% in Sep 2024
Growth in half year ended Sep 2025 is -22.42% vs 136.57% in Sep 2024
Nine Monthly Results Snapshot (Consolidated) - Dec'24

YoY Growth in nine months ended Dec 2024 is 58.50% vs -0.02% in Dec 2023
YoY Growth in nine months ended Dec 2024 is 233.42% vs -28.20% in Dec 2023
Annual Results Snapshot (Consolidated) - Mar'25
YoY Growth in year ended Mar 2025 is 48.20% vs -2.86% in Mar 2024
YoY Growth in year ended Mar 2025 is 83.16% vs -15.47% in Mar 2024
About Amber Enterprises India Ltd

Company Coordinates


