
Dashboard
With ROE of 13, it has a Expensive valuation with a 3.2 Price to Book Value
- The stock is trading at a discount compared to its peers' average historical valuations
- Over the past year, while the stock has generated a return of -9.56%, its profits have risen by 13.1% ; the PEG ratio of the company is 1.9
54.05% of Promoter Shares are Pledged
Consistent Underperformance against the benchmark over the last 3 years
Stock DNA
Housing Finance Company
INR 11,904 Cr (Small Cap)
24.00
13
0.00%
3.29
13.00%
3.17
Total Returns (Price + Dividend) 
Aavas Financiers for the last several years.
Risk Adjusted Returns v/s
Returns Beta

News
Aavas Financiers Ltd. is Rated Sell
Aavas Financiers Ltd. is rated 'Sell' by MarketsMOJO, with this rating last updated on 18 Nov 2025. However, the analysis and financial metrics discussed here reflect the stock's current position as of 25 December 2025, providing investors with the latest insights into its performance and outlook.
Read More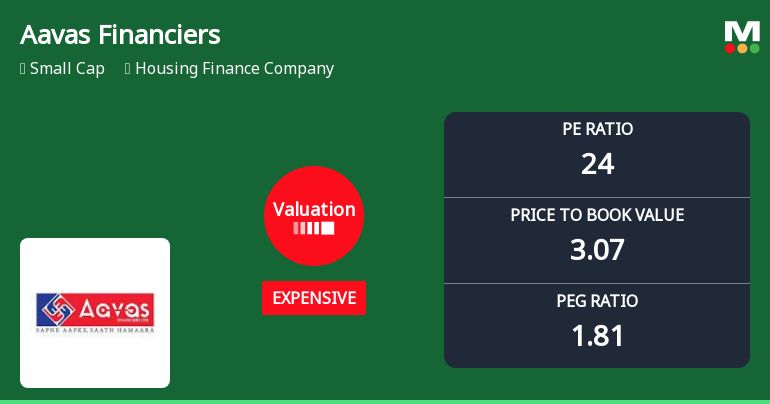
Aavas Financiers Valuation Shift Highlights Price Attractiveness Amid Sector Dynamics
Aavas Financiers has experienced a notable revision in its valuation parameters, reflecting a shift in market assessment that impacts its price attractiveness relative to historical levels and peer comparisons within the housing finance sector.
Read More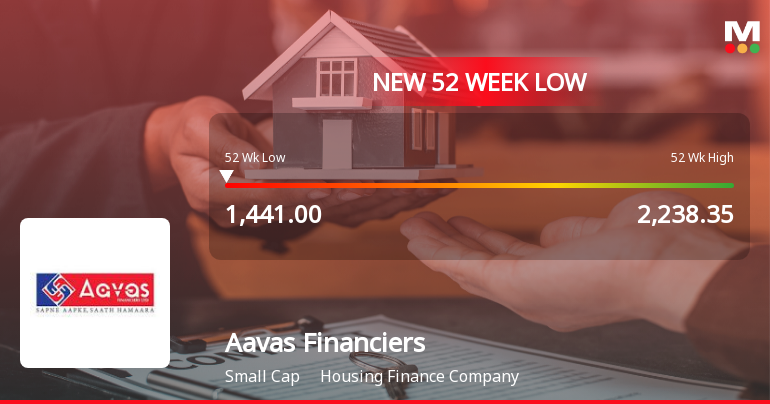
Aavas Financiers Falls to 52-Week Low of Rs.1438.35 Amidst Market Headwinds
Aavas Financiers, a prominent player in the housing finance sector, recorded a new 52-week low of Rs.1438.35 today, marking a significant decline in its stock price amid a broader market environment that has seen mixed performances across sectors.
Read More Announcements
Board Meeting Outcome for Outcome Of Executive Committee Meeting Of Board Of Directors Held On December 23 2025
23-Dec-2025 | Source : BSEOutcome of Executive Committee Meeting of Board of Directors held on December 23 2025
Announcement Under Regulation 30 And 51 Of SEBI (LODR) Regulation 2015
23-Dec-2025 | Source : BSEAnnouncement under Regulation 30 and 51 of SEBI (LODR) Regulation 2015
Closure of Trading Window
23-Dec-2025 | Source : BSEIntimation of Closure of Trading Window
Corporate Actions

No Upcoming Board Meetings

No Dividend history available

No Splits history available

No Bonus history available

No Rights history available
Quality key factors
Valuation key factors
Technicals key factors
 Technical Indicator Scale: Bearish, Mildly Bearish, Sideways, Mildly Bullish, Bullish Turned
 Shareholding Snapshot : Jun 2025
Shareholding Compare (%holding)
Promoters
54.0521
Held by 21 Schemes (8.44%)
Held by 170 FIIs (29.77%)
Aquilo House Pte. Ltd. (48.96%)
Nippon Life India Trustee Ltd-a/c Nippon India Small Cap Fund (3.13%)
7.53%
Quarterly Results Snapshot (Standalone) - Sep'25 - QoQ

QoQ Growth in quarter ended Sep 2025 is 6.29% vs -1.36% in Jun 2025
QoQ Growth in quarter ended Sep 2025 is 17.74% vs -9.40% in Jun 2025
Half Yearly Results Snapshot (Standalone) - Sep'25

Growth in half year ended Sep 2025 is 15.43% vs 16.41% in Sep 2024
Growth in half year ended Sep 2025 is 10.64% vs 18.40% in Sep 2024
Nine Monthly Results Snapshot (Standalone) - Dec'24
YoY Growth in nine months ended Dec 2024 is 16.77% vs 26.98% in Dec 2023
YoY Growth in nine months ended Dec 2024 is 20.79% vs 14.76% in Dec 2023
Annual Results Snapshot (Standalone) - Mar'25
YoY Growth in year ended Mar 2025 is 16.70% vs 25.44% in Mar 2024
YoY Growth in year ended Mar 2025 is 17.00% vs 14.10% in Mar 2024
About Aavas Financiers Ltd.

Company Coordinates


