
Dashboard
Strong ability to service debt as the company has a low Debt to EBITDA ratio of 0.91 times
Healthy long term growth as Net Sales has grown by an annual rate of 53.70%
With a growth in Net Profit of 212.16%, the company declared Very Positive results in Sep 25
With ROCE of 7.3, it has a Expensive valuation with a 3.4 Enterprise value to Capital Employed
Despite the size of the company, domestic mutual funds hold only 0% of the company
Consistent Returns over the last 3 years
Stock DNA
Garments & Apparels
INR 654 Cr (Micro Cap)
59.00
22
0.00%
0.24
6.73%
3.92
Total Returns (Price + Dividend) 
Sunrakshakk Inds for the last several years.
Risk Adjusted Returns v/s
Returns Beta

News

Sunrakshakk Inds Sees Revision in Market Evaluation Amid Mixed Financial Signals
Sunrakshakk Inds, a microcap player in the Garments & Apparels sector, has experienced a revision in its market evaluation reflecting a nuanced shift in its financial and technical outlook. This adjustment follows a detailed reassessment of the company’s quality, valuation, financial trends, and technical indicators, providing investors with a clearer perspective on its current standing.
Read More
Sunrakshakk Industries India Shows Mixed Technical Signals Amid Price Momentum Shift
Sunrakshakk Industries India, a key player in the Garments & Apparels sector, is currently exhibiting a complex technical landscape as recent evaluation adjustments reflect a shift from a mildly bullish trend to a sideways momentum. This article analyses the latest technical indicators including MACD, RSI, moving averages, and price action to provide a comprehensive view of the stock’s current market posture.
Read More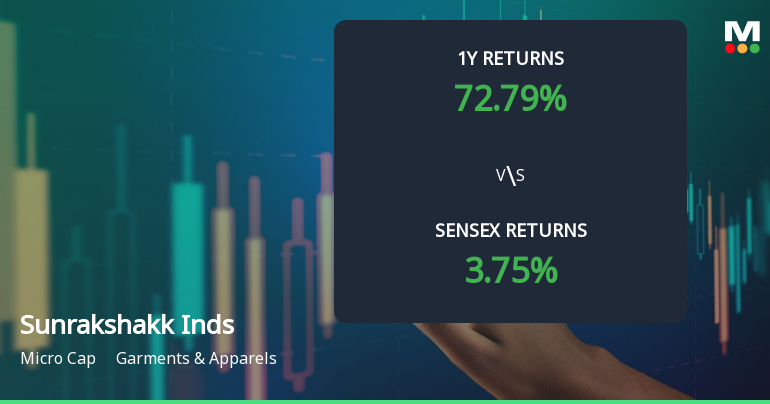
Sunrakshakk Industries India Shows Mixed Technical Signals Amid Price Momentum Shift
Sunrakshakk Industries India, a key player in the Garments & Apparels sector, has exhibited a notable shift in its price momentum and technical indicators, reflecting a nuanced market assessment. Recent data reveals a transition from a sideways trend to a mildly bullish stance, accompanied by mixed signals from key technical tools such as MACD, RSI, and moving averages.
Read More Announcements
Announcement under Regulation 30 (LODR)-Investor Presentation
14-Nov-2025 | Source : BSEINVESTOR PRESENTION OF THE COMPANY FOR THE QUARTER AND HALF YEAR ENDED SEPTEMBER2025
Announcement under Regulation 30 (LODR)-Press Release / Media Release
14-Nov-2025 | Source : BSEPress Release of Consolidated Financial of quarter and half year ended September 2025
Announcement under Regulation 30 (LODR)-Investor Presentation
14-Nov-2025 | Source : BSEPlease find Investor Presentation Q2 H1 FY26 of the company
Corporate Actions

No Upcoming Board Meetings

No Dividend history available

Sunrakshakk Industries India Ltd has announced 2:10 stock split, ex-date: 17 Oct 25

No Bonus history available

No Rights history available
Quality key factors
Valuation key factors
Technicals key factors
 Technical Indicator Scale: Bearish, Mildly Bearish, Sideways, Mildly Bullish, Bullish Turned
 Shareholding Snapshot : Sep 2025
Shareholding Compare (%holding)
Promoters
None
Held by 0 Schemes
Held by 0 FIIs
Fashion Suiting Pvt Ltd (43.96%)
Authum Investement And Infrastructure Limited (3.95%)
22.6%
Quarterly Results Snapshot (Standalone) - Sep'25 - QoQ

QoQ Growth in quarter ended Sep 2025 is 23.57% vs -7.13% in Jun 2025
QoQ Growth in quarter ended Sep 2025 is 212.16% vs -30.19% in Jun 2025
Half Yearly Results Snapshot (Standalone) - Sep'25
Growth in half year ended Sep 2025 is 8.69% vs -12.71% in Sep 2024
Growth in half year ended Sep 2025 is 28.81% vs -39.49% in Sep 2024
Nine Monthly Results Snapshot (Standalone) - Dec'24

YoY Growth in nine months ended Dec 2024 is -10.70% vs 3.08% in Dec 2023
YoY Growth in nine months ended Dec 2024 is -31.43% vs 15.05% in Dec 2023
Annual Results Snapshot (Standalone) - Mar'25
YoY Growth in year ended Mar 2025 is -11.25% vs 0.70% in Mar 2024
YoY Growth in year ended Mar 2025 is -33.37% vs 15.44% in Mar 2024
About Sunrakshakk Industries India Ltd

Company Coordinates


