
Dashboard
Strong lending practices with low Gross NPA ratio of 2.16%
Strong Long Term Fundamental Strength with a 195.58% CAGR growth in Net Profits
Healthy long term growth as Net profit has grown by an annual rate of 195.58%
With ROA of 1.1, it has a Attractive valuation with a 1 Price to Book Value
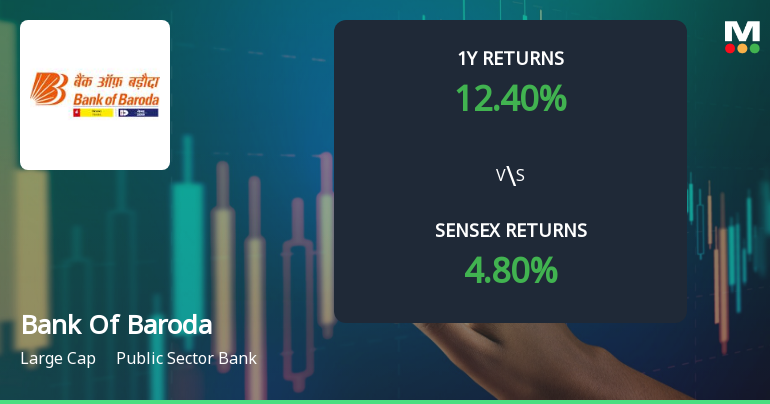
Total Returns (Price + Dividend) 
Latest dividend: 8.34 per share ex-dividend date: Jun-06-2025
Risk Adjusted Returns v/s
Returns Beta

News
Bank Of Baroda Technical Momentum Shifts Signal Bullish Outlook Amid Mixed Indicators
Bank Of Baroda has exhibited a notable shift in its technical momentum, moving from a mildly bullish stance to a more pronounced bullish trend. This development is underscored by a combination of technical indicators including MACD, RSI, moving averages, and Bollinger Bands, which collectively paint a nuanced picture of the stock’s current market positioning and potential trajectory.
Read More
Bank Of Baroda Sees Revised Market Evaluation Amid Strong Financial Indicators
Bank Of Baroda has experienced a revision in its market evaluation, reflecting shifts in key analytical parameters that highlight the bank’s financial health, valuation, and technical outlook. This development comes amid a backdrop of steady returns and robust fundamental metrics within the public sector banking space.
Read More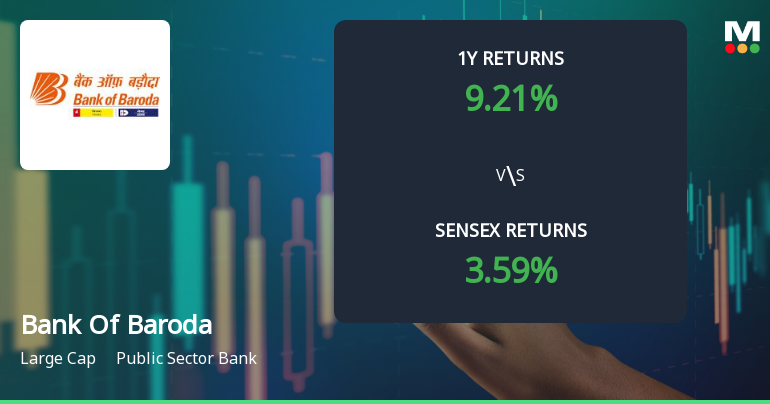
Bank Of Baroda Technical Momentum Shifts Amid Mixed Indicator Signals
Bank Of Baroda’s recent market activity reveals a nuanced shift in technical momentum, reflecting a complex interplay of bullish and bearish signals across key indicators. While the stock maintains a generally positive trend on longer-term charts, shorter-term oscillators suggest caution as price momentum shows signs of moderation.
Read More Announcements
Closure of Trading Window
24-Dec-2025 | Source : BSEClosure of Trading Window - Q3
Disclosure Under Regulation 30 Of SEBI (LODR) Regulations 2015
19-Dec-2025 | Source : BSEDisclosure Under Regulation 30 of SEBI (LODR)
Subscription Of Shares Of Indian Digital Payment Intelligence Corporation
11-Dec-2025 | Source : BSESubscription of Shares of Indian Digital Payment Intelligence Corporation (IDPIC)
Corporate Actions

No Upcoming Board Meetings

Bank Of Baroda has declared 417% dividend, ex-date: 06 Jun 25

Bank Of Baroda has announced 2:10 stock split, ex-date: 22 Jan 15

No Bonus history available

No Rights history available
Quality key factors
Valuation key factors
Technicals key factors
 Technical Indicator Scale: Bearish, Mildly Bearish, Sideways, Mildly Bullish, Bullish Turned
 Shareholding Snapshot : Sep 2025
Shareholding Compare (%holding)
Promoters
None
Held by 40 Schemes (10.04%)
Held by 661 FIIs (8.71%)
President Of India (63.97%)
Lic Ulip Growth Fund (6.64%)
6.87%
Quarterly Results Snapshot (Standalone) - Sep'25 - QoQ

QoQ Growth in quarter ended Sep 2025 is 1.35% vs -0.08% in Jun 2025
QoQ Growth in quarter ended Sep 2025 is 5.90% vs -10.03% in Jun 2025
Half Yearly Results Snapshot (Standalone) - Sep'25

Growth in half year ended Sep 2025 is 4.5% vs 10.09% in Sep 2024
Growth in half year ended Sep 2025 is -3.56% vs 16.50% in Sep 2024
Nine Monthly Results Snapshot (Standalone) - Dec'24
YoY Growth in nine months ended Dec 2024 is 9.39% vs 30.27% in Dec 2023
YoY Growth in nine months ended Dec 2024 is 12.64% vs 38.22% in Dec 2023
Annual Results Snapshot (Standalone) - Mar'25
YoY Growth in year ended Mar 2025 is 8.61% vs 25.69% in Mar 2024
YoY Growth in year ended Mar 2025 is 10.08% vs 26.08% in Mar 2024
About Bank Of Baroda

Company Coordinates


