There is a lot of talk in the market that the Sensex (or the Nifty) is very close to the 200-Day Moving Average and that if the Sensex goes below the 200-Day Moving Average the market will turn bearish.
Let me start by saying that I am not a Technical expert but at least I can look at the data and see what the past evidence says. So, I decided to dig deeper.
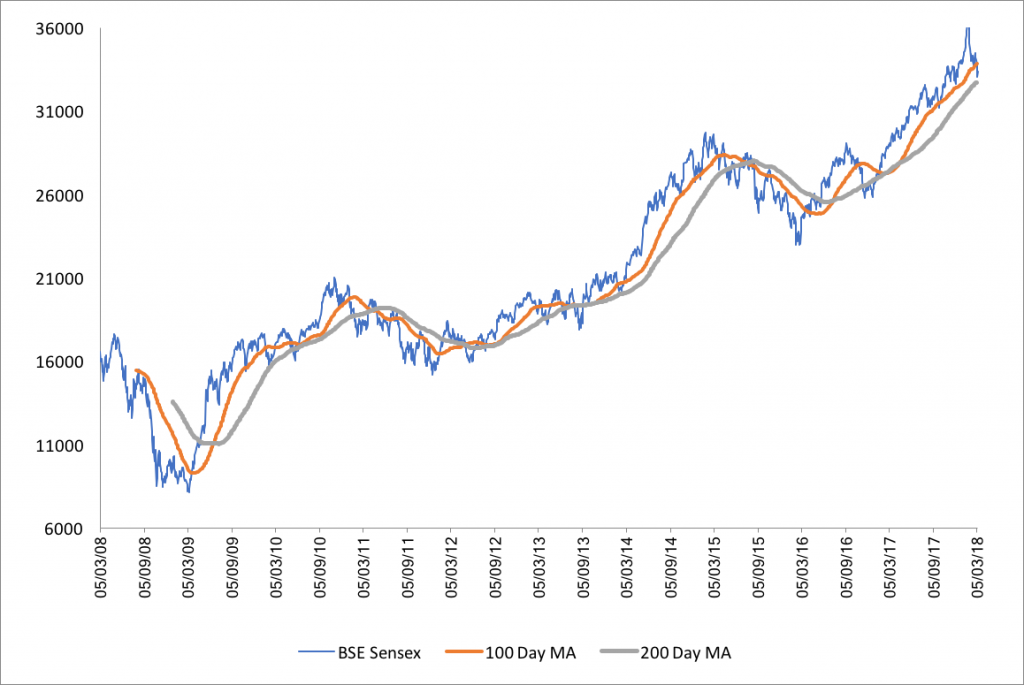
I looked at the last 10 years data. I plotted the 10 year Sensex chart with 100-Day and 200-Day Simple Moving Average. See the chart below.
The evidence is interesting. Here are the key points:
- Starting March 2009, when the market started its uptrend post the Global Financial Crisis, the market is up around 4.1 times.
- In this move, there have been two periods of 1 year or more when the market fell. The first one in 2011-12 and the second one in 2012-13.
- In both these periods market went below the 200-Day Moving Average and stayed there for a while.
- However, there were a few other occasions when the market went below the 200 Day Moving Average but bounced back relatively quickly. The last such move was post the Demonetisation in December 2016.
- The evidence shows that 200 Day Moving Average is mostly a good indicator, but not always.
- The MOST interesting evidence from the data that I found was that the 200 Day moving average in conjunction with the 100-Day Moving Average is a far better indicator.
- In both the periods. mentioned above, where the Market was in a downtrend for 1 year or more, the 100 Day Moving Average had fallen below the 200 Day Moving Average.
- So, based on the evidence from the last 10 years, it seems that a longish downtrend only happened When the Market is below the 200 Day Moving Average AND the 100 day Moving Average is below the 200 Day Moving Average.
Where are we now?
- As of yesterday’s close, the BSE Sensex was at 33351,
- the 200 Day Moving Average was at 32733 and,
- the 100- Day Moving Average was at 33854.
Not much room for comfort but something to monitor.
What does this mean for Long Term Buy & Hold Investors?
The technical tools mentioned above are tools to “time” entry and exit in the market and may be useful for Active Investors. For Buy & Hold investors, Peter Lynch has summed it up very well “You get recessions, you have stock market declines. If you don’t understand that’s going to happen, then you’re not ready, you won’t do well in the markets.”
As long as the long-term fundamentals of the stocks a Buy & Hold investor holds are fine and the valuation is not too expensive, it is better for such an investor to stay put and monitor the fundamentals closely. Of course as I had mentioned in my last piece, it is not easy to do that!
Please Note:
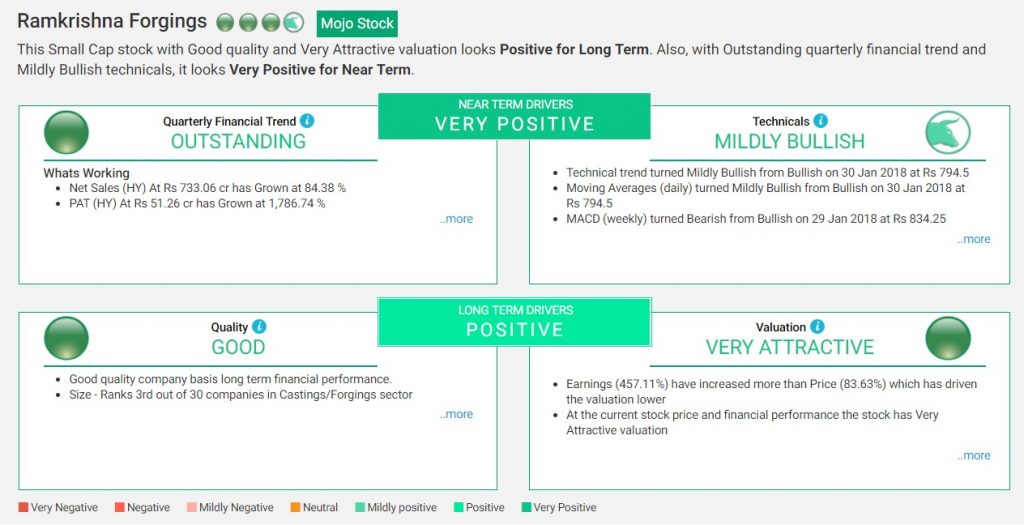
You can now monitor the short term drivers (including technicals) and long term drivers of your stocks on our brand new Dashboard.

Sanjeev Mohta
Market Expert
Sanjeev Mohta is the Market Expert at Marketsmojo. He has over 27 years’ experience in Investment Research and Fund management across Asian Markets and Asset classes. He has worked in various organisations in Singapore and India like Alchemy, QVT, Jefferies, ABN Amro and HSBC Securities. He Has a PhD in Economics from Tulane University, USA.