
Dashboard
Weak Long Term Fundamental Strength with an average Return on Capital Employed (ROCE) of 0%
- Poor long term growth as Net Sales has grown by an annual rate of -8.21% and Operating profit at -3.42% over the last 5 years
- Company's ability to service its debt is weak with a poor EBIT to Interest (avg) ratio of -0.03
With ROCE of 14.7, it has a Very Expensive valuation with a 29.3 Enterprise value to Capital Employed
Despite the size of the company, domestic mutual funds hold only 0% of the company
Underperformed the market in the last 1 year
Stock DNA
Diversified Commercial Services
INR 659 Cr (Micro Cap)
351.00
30
0.00%
0.38
11.44%
40.11
Total Returns (Price + Dividend) 
Banganga Paper for the last several years.
Risk Adjusted Returns v/s
Returns Beta

News

Banganga Paper Industries: Technical Momentum Shifts Amid Mixed Market Signals
Banganga Paper Industries has experienced a notable shift in its technical momentum, moving from a mildly bearish stance to a sideways trend, reflecting a complex interplay of market forces and technical indicators. This development comes amid a backdrop of mixed signals from key momentum and trend-following tools, offering investors a nuanced perspective on the stock’s near-term trajectory.
Read More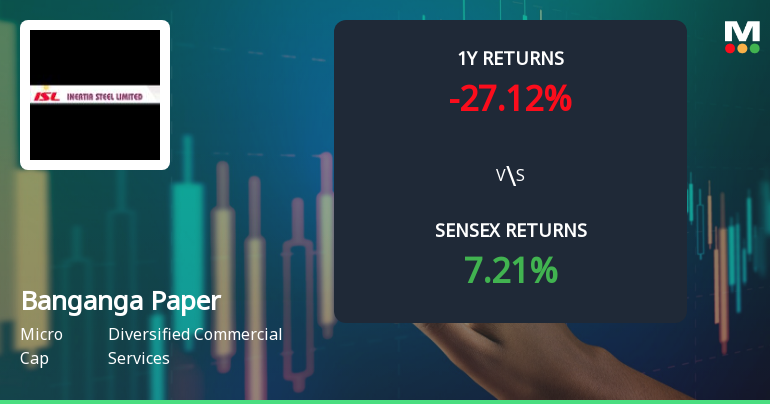
Banganga Paper Industries Sees Shift in Technical Momentum Amid Mixed Market Signals
Banganga Paper Industries has experienced a notable shift in its technical momentum, reflecting a complex interplay of market forces and analytical indicators. Recent evaluation adjustments reveal a transition from a sideways trend to a mildly bearish stance, with key technical parameters such as MACD, RSI, and moving averages offering a nuanced picture of the stock’s near-term outlook.
Read More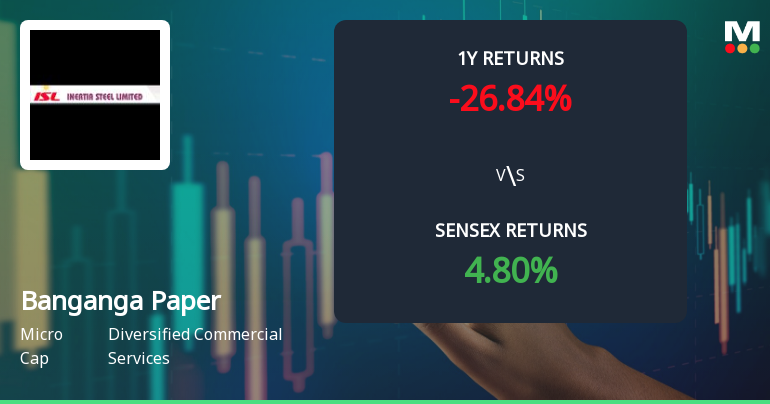
Banganga Paper Industries Sees Shift in Technical Momentum Amid Mixed Market Signals
Banganga Paper Industries has experienced a notable shift in its technical momentum, reflecting a complex interplay of market forces and indicator signals. The stock’s recent price movements and technical parameters suggest a transition from a mildly bullish stance to a more sideways trend, underscoring the nuanced challenges facing this diversified commercial services company.
Read More Announcements
Intimation Of Extra Ordinary General Meeting Of The Company Pursuant To Regulation 30 Of The SEBI (Listing Obligations And Disclosure Requirements) Regulations 2015
23-Dec-2025 | Source : BSEAs per the attachment
Detailed Public Statement
22-Dec-2025 | Source : BSENavigant Corporate Advisors Ltd (Manager to the Offer) has submitted to BSE a copy of Detailed Public Statement for the attention of the Equity Shareholders of Banganga Paper Industries Ltd (Target Company).
Public Announcement - Open Offer
18-Dec-2025 | Source : BSENavigant Corporate Advisors Ltd (Manager to the Offer) has submitted to BSE a copy of Public Announcement under Regulation 3 (1) Regulation 4 Read With Regulation 15 (1) Regulation 13 (2) (G) of SEBI (Substantial acquistion of shares and takeovers) Regulations 2011 for the attention of the Equity Shareholders of Banganga Paper Industries Ltd (Target Company).
Corporate Actions

No Upcoming Board Meetings

No Dividend history available

Banganga Paper Industries Ltd has announced 1:10 stock split, ex-date: 03 Jan 25

No Bonus history available

No Rights history available
Quality key factors
Valuation key factors
Technicals key factors
 Technical Indicator Scale: Bearish, Mildly Bearish, Sideways, Mildly Bullish, Bullish Turned
 Shareholding Snapshot : Sep 2025
Shareholding Compare (%holding)
Promoters
None
Held by 0 Schemes
Held by 0 FIIs
Karbhari Pandurang Dhatrak_preferential (35.48%)
Ankur Bhupendra Shah (4.62%)
23.49%
Quarterly Results Snapshot (Consolidated) - Sep'25 - YoY

YoY Growth in quarter ended Sep 2025 is 42.89% vs 16,780.00% in Sep 2024

YoY Growth in quarter ended Sep 2025 is 30.77% vs 0.00% in Sep 2024
Half Yearly Results Snapshot (Consolidated) - Sep'25
Growth in half year ended Sep 2025 is 168.25% vs 8,784.21% in Sep 2024
Growth in half year ended Sep 2025 is 583.33% vs 1,100.00% in Sep 2024
Nine Monthly Results Snapshot (Standalone) - Dec'24
YoY Growth in nine months ended Dec 2024 is -100.00% vs 26.09% in Dec 2023
YoY Growth in nine months ended Dec 2024 is -1,100.00% vs -107.14% in Dec 2023
Annual Results Snapshot (Standalone) - Mar'25
YoY Growth in year ended Mar 2025 is -100.00% vs 21.88% in Mar 2024
YoY Growth in year ended Mar 2025 is -700.00% vs -114.29% in Mar 2024
About Banganga Paper Industries Ltd

Company Coordinates


