
Stock DNA
Pharmaceuticals & Biotechnology
INR 56 Cr (Micro Cap)
2.00
34
0.00%
1.20
33.54%
0.54
Total Returns (Price + Dividend) 
Welcure Drugs for the last several years.
Risk Adjusted Returns v/s
Returns Beta

News

Welcure Drugs & Pharmaceuticals Ltd is Rated Sell
Welcure Drugs & Pharmaceuticals Ltd is rated Sell by MarketsMOJO. This rating was last updated on 14 Nov 2025, reflecting a reassessment of the stock’s outlook. However, all fundamentals, returns, and financial metrics discussed here are based on the company’s current position as of 25 December 2025, providing investors with the most up-to-date analysis.
Read More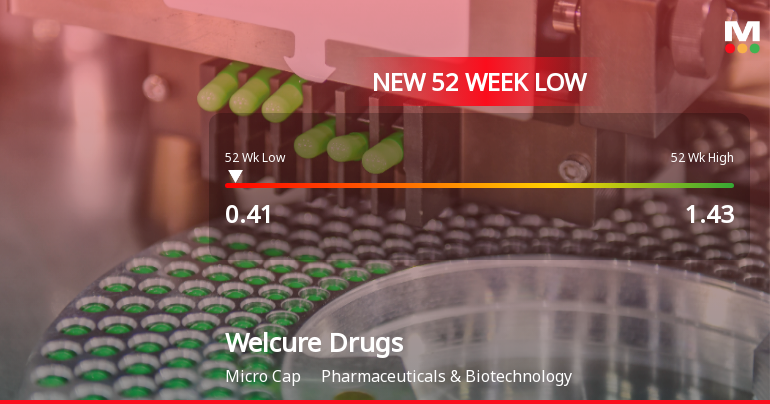
Welcure Drugs & Pharmaceuticals Falls to 52-Week Low of Rs.0.41
Welcure Drugs & Pharmaceuticals has reached a new 52-week low of Rs.0.41, marking a significant decline in its stock price amid a contrasting market environment where the Sensex continues to advance towards its own yearly highs.
Read More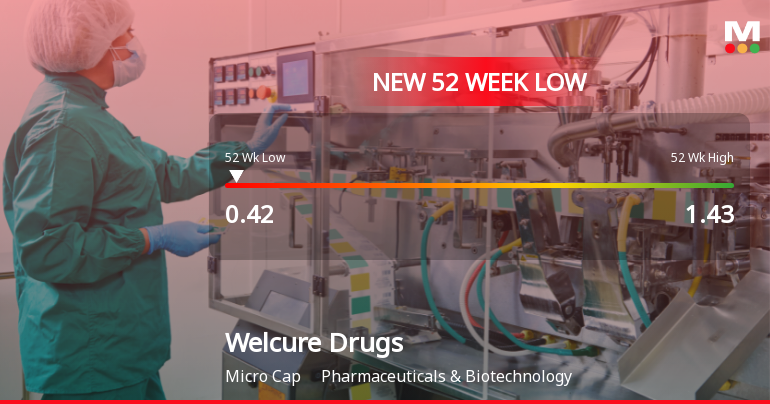
Welcure Drugs & Pharmaceuticals Falls to 52-Week Low of Rs.0.42
Welcure Drugs & Pharmaceuticals has reached a new 52-week low of Rs.0.42, marking a significant decline in its stock price amid a broader market environment where the Sensex trades near its yearly highs. The stock has recorded a four-day consecutive fall, accumulating a loss of 14% over this period, underperforming its sector by 1.51% today.
Read More Announcements
Closure of Trading Window
24-Dec-2025 | Source : BSEIntimation of Closure of Trading Window
Board Meeting Outcome for Outcome Of The Meeting Of The Board Of Directors Of Welcure Drugs And Pharmaceuticals Limited Held Today I.E. Saturday December 06 2025
06-Dec-2025 | Source : BSEOutcome of the Meeting of the Board of Directors of Welcure Drugs and Pharmaceuticals Limited held today i.e. Saturday December 06 2025
Postponement Of The Meeting Of The Rights Issue Committee Of Welcure Drugs And Pharmaceuticals Limited Which Was To Be Held Today I.E. Monday December 05 2025
05-Dec-2025 | Source : BSEPostponment of the meeting of the Right Issue Committe of the Welcure Drugs and Pharmaceuticals Limited which was to be held today i.e MondayDecember 052025
Corporate Actions

No Upcoming Board Meetings

No Dividend history available

Welcure Drugs & Pharmaceuticals Ltd has announced 1:10 stock split, ex-date: 16 Oct 25

Welcure Drugs & Pharmaceuticals Ltd has announced 1:10 bonus issue, ex-date: 16 Oct 25

No Rights history available
Quality key factors
Valuation key factors
Technicals key factors
 Technical Indicator Scale: Bearish, Mildly Bearish, Sideways, Mildly Bullish, Bullish Turned
 Shareholding Snapshot : Sep 2025
Shareholding Compare (%holding)
Non Institution
None
Held by 0 Schemes
Held by 0 FIIs
None
Techroxy Solution Private Limited (1.78%)
91.83%
Quarterly Results Snapshot (Standalone) - Sep'25 - QoQ

QoQ Growth in quarter ended Sep 2025 is -78.12% vs 1,314.00% in Jun 2025
QoQ Growth in quarter ended Sep 2025 is -63.52% vs 817.32% in Jun 2025
Half Yearly Results Snapshot (Standalone) - Sep'25

Growth in half year ended Sep 2025 is 1,388.96% vs 0.00% in Sep 2024
Growth in half year ended Sep 2025 is 2,034.23% vs 1,246.15% in Sep 2024
Nine Monthly Results Snapshot (Standalone) - Dec'24
YoY Growth in nine months ended Dec 2024 is 0.00% vs 0.00% in Dec 2023
YoY Growth in nine months ended Dec 2024 is 1,056.25% vs -166.67% in Dec 2023
Annual Results Snapshot (Standalone) - Mar'25
YoY Growth in year ended Mar 2025 is 0.00% vs 0.00% in Mar 2024
YoY Growth in year ended Mar 2025 is 1,376.47% vs -270.00% in Mar 2024
About Welcure Drugs & Pharmaceuticals Ltd

Company Coordinates


