
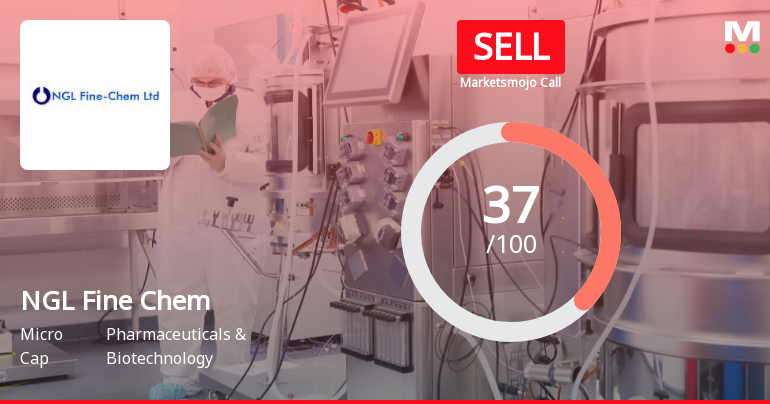
Stock DNA
Pharmaceuticals & Biotechnology
INR 817 Cr (Micro Cap)
39.00
34
0.13%
0.11
6.89%
2.73
Total Returns (Price + Dividend) 
Latest dividend: 1.75 per share ex-dividend date: Aug-12-2025
Risk Adjusted Returns v/s
Returns Beta

News
NGL Fine Chem’s Market Assessment Reflects Challenges Amidst Technical and Financial Shifts
NGL Fine Chem, a player in the Pharmaceuticals & Biotechnology sector, has experienced a notable revision in its market evaluation, influenced by shifts in technical indicators, valuation metrics, financial trends, and broader market performance. This article analyses the factors shaping the current assessment of the company’s stock and its implications for investors.
Read More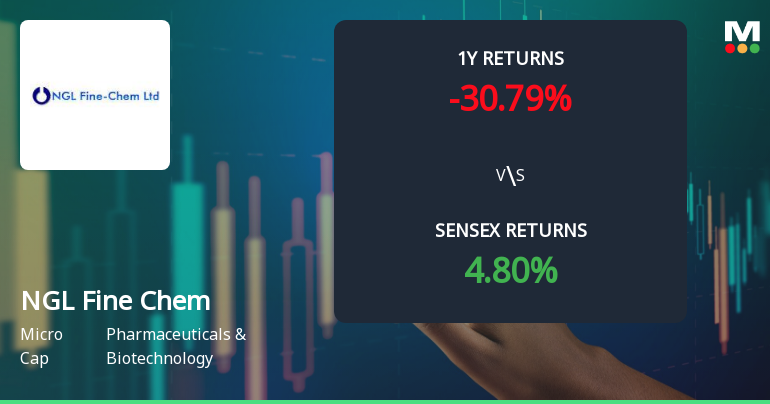
NGL Fine Chem Technical Momentum Shifts Amid Mixed Market Signals
NGL Fine Chem, a key player in the Pharmaceuticals & Biotechnology sector, has experienced a notable shift in its technical momentum, reflecting a complex interplay of market forces and indicator signals. Recent evaluation adjustments reveal a transition from mildly bullish to mildly bearish trends, underscoring a nuanced market assessment for this stock.
Read More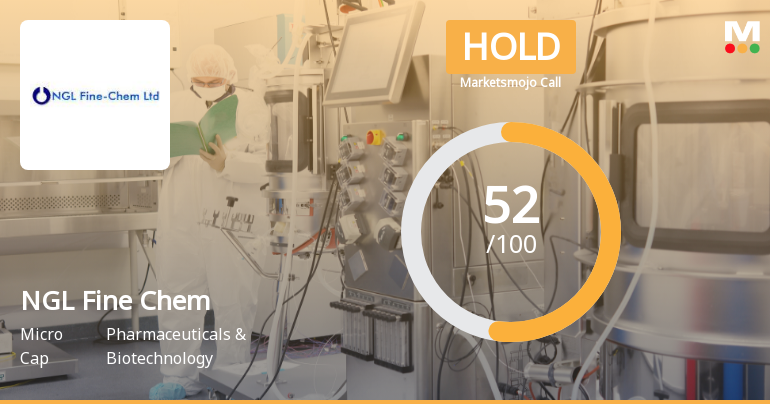
NGL Fine Chem: Analytical Perspective Shifts Amid Mixed Financial and Technical Signals
NGL Fine Chem, a player in the Pharmaceuticals & Biotechnology sector, has experienced a revision in its market assessment following a detailed evaluation of its quality, valuation, financial trends, and technical indicators. Despite a challenging financial backdrop and subdued long-term growth, recent technical developments and valuation considerations have influenced a nuanced shift in the company’s analytical perspective.
Read More Announcements
Announcement under Regulation 30 (LODR)-Analyst / Investor Meet - Outcome
24-Dec-2025 | Source : BSEInvestor meet outcome
Announcement under Regulation 30 (LODR)-Analyst / Investor Meet - Intimation
23-Dec-2025 | Source : BSEPursuant to Regulation 30(6) of the Securities and Exchange Board of India (Listing Obligations and Disclosure Requirements) Regulations 2015 and further to our intimation of Investor Call dated 18th December 2025 we would like to inform you that the meeting is rescheduled to Wednesday 24th December 2025 as per detail below. Date Type of Meeting Mode of Meeting Wednesday December 24 2025 One-on-One Virtual Kindly note that changes may happen due to exigencies on the part of Participants /Company. No unpublished price sensitive information will be disclosed or discussed.
Announcement under Regulation 30 (LODR)-Analyst / Investor Meet - Intimation
18-Dec-2025 | Source : BSEPursuant to Regulation 30(6) of the SEBI (Listing Obligations and Disclosure Requirements) Regulations 2015 we would like to inform you that Mr. Rahul Nachane Managing Director of the Company will have a meeting with Investor(s)/ Analyst(s) (Participants) on 23rd December 2025. We would further like to inform you that the copy of Investor presentation has been submitted with the stock exchange and has also been uploaded on the website of the Company www.nglfinechem.com for the information of members and the public at large. Kindly note that changes may happen due to exigencies on the part of Participants /Company. No unpublished price sensitive information will be disclosed or discussed.
Corporate Actions

No Upcoming Board Meetings

NGL Fine Chem Ltd has declared 35% dividend, ex-date: 12 Aug 25

No Splits history available

No Bonus history available

No Rights history available
Quality key factors
Valuation key factors
Technicals key factors
 Technical Indicator Scale: Bearish, Mildly Bearish, Sideways, Mildly Bullish, Bullish Turned
 Shareholding Snapshot : Jun 2025
Shareholding Compare (%holding)
Promoters
None
Held by 2 Schemes (0.0%)
Held by 1 FIIs (0.0%)
Rajesh Lawande (21.89%)
None
23.0%
Quarterly Results Snapshot (Consolidated) - Sep'25 - YoY

YoY Growth in quarter ended Sep 2025 is 28.65% vs 16.59% in Sep 2024
YoY Growth in quarter ended Sep 2025 is -1.83% vs -6.39% in Sep 2024
Half Yearly Results Snapshot (Consolidated) - Sep'25

Growth in half year ended Sep 2025 is 21.82% vs 21.84% in Sep 2024
Growth in half year ended Sep 2025 is -0.84% vs 0.26% in Sep 2024
Nine Monthly Results Snapshot (Consolidated) - Dec'24
YoY Growth in nine months ended Dec 2024 is 14.29% vs 17.09% in Dec 2023
YoY Growth in nine months ended Dec 2024 is -29.99% vs 148.37% in Dec 2023
Annual Results Snapshot (Consolidated) - Mar'25
YoY Growth in year ended Mar 2025 is 8.73% vs 21.80% in Mar 2024
YoY Growth in year ended Mar 2025 is -48.89% vs 101.56% in Mar 2024
About NGL Fine Chem Ltd

Company Coordinates


