
Dashboard
Poor long term growth as Operating profit has grown by an annual rate -8.99% of over the last 5 years
Negative results in Sep 25
With ROE of 5.5, it has a Very Expensive valuation with a 2.1 Price to Book Value
Despite the size of the company, domestic mutual funds hold only 0% of the company
Stock DNA
Software Products
INR 512 Cr (Micro Cap)
39.00
29
0.50%
-0.43
5.45%
2.12
Total Returns (Price + Dividend) 
Latest dividend: 1.25 per share ex-dividend date: Aug-22-2025
Risk Adjusted Returns v/s
Returns Beta

News

ABM Knowledgeware Ltd is Rated Sell
ABM Knowledgeware Ltd is rated 'Sell' by MarketsMOJO, with this rating last updated on 02 Dec 2025. However, the analysis and financial metrics discussed here reflect the stock's current position as of 24 December 2025, providing investors with the latest insights into its performance and outlook.
Read More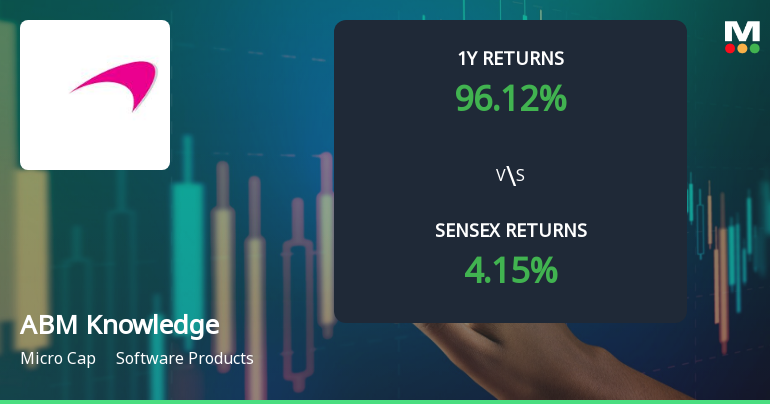
ABM Knowledgeware Technical Momentum Shifts Amid Mixed Market Signals
ABM Knowledgeware, a key player in the Software Products sector, has experienced a nuanced shift in its technical momentum, reflecting a complex interplay of bullish and bearish indicators. Recent evaluation adjustments highlight a transition from a bullish to a mildly bullish trend, with technical parameters such as MACD, RSI, and moving averages signalling a mixed outlook for investors navigating the stock’s near-term trajectory.
Read More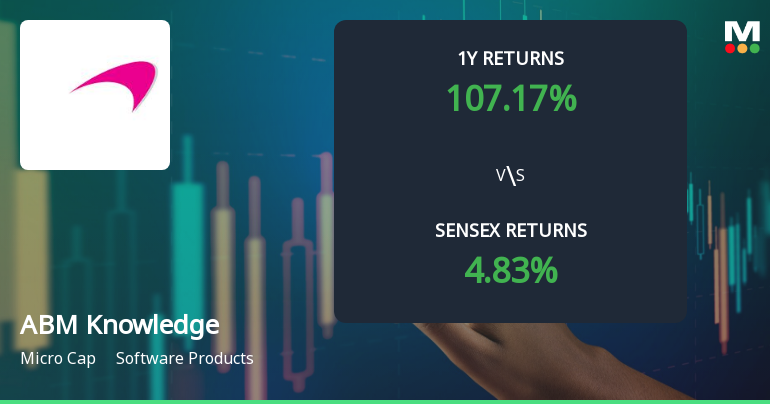
ABM Knowledgeware Shows Shift in Price Momentum Amid Technical Indicator Changes
ABM Knowledgeware, a player in the Software Products sector, has exhibited a notable shift in its price momentum, supported by recent changes in key technical indicators. The stock’s current price stands at ₹276.05, reflecting a day change of 4.98%, as it navigates a landscape marked by bullish signals across multiple timeframes.
Read More Announcements
Announcement Under Regulation 30 Of SEBI (LODR) Regulations 2015 - Earning Release
15-Nov-2025 | Source : BSEEarning Release for the quarter ended 30th September 2025.
Board Meeting Outcome for Board Meeting Outcome For Un-Audited (Standalone And Consolidated) Financial Results For The Quarter Ended 30Th September 2025.
14-Nov-2025 | Source : BSEPursuant to Regulation 30 of the SEBI (Listing Obligations and Disclosure Requirements) Regulations 2015 (Listing Regulations) this is to inform you that the Board of Directors of the Company at their meeting held today i.e. on 14th November 2025 through Video Conferencing (VC) have: 1. Approved the Un-audited Financial results (Standalone & Consolidated) for the quarter ended and Half-year ended 30 September 2025 pursuant to Regulation 33 of SEBI (LODR) Regulations 2015. 2. Approved Limited Review Report for the Un-audited Financial Results (Standalone and Consolidated) for the quarter ended and Half-year ended 30 September 2025 from our Statutory Auditors M/s A P Sanzgiri & Co. Chartered Accountants in the terms of Regulation 33 of the SEBI (Listing Obligation and Disclosure Requirements) Regulations 2015.
Un-Audited Financial Results (Standalone And Consolidated) For The Quarter Ended 30Th September 2025.
14-Nov-2025 | Source : BSEDeclaration of Un-audited Financial Results (Standalone & Consolidated) for the quarter ended 30th September 2025.
Corporate Actions

No Upcoming Board Meetings

ABM Knowledgeware Ltd has declared 25% dividend, ex-date: 22 Aug 25

ABM Knowledgeware Ltd has announced 5:10 stock split, ex-date: 07 Apr 16

No Bonus history available

No Rights history available
Quality key factors
Valuation key factors
Technicals key factors
 Technical Indicator Scale: Bearish, Mildly Bearish, Sideways, Mildly Bullish, Bullish Turned
 Shareholding Snapshot : Sep 2025
Shareholding Compare (%holding)
Promoters
None
Held by 0 Schemes
Held by 0 FIIs
Prakash Baburao Rane (47.71%)
New Computer Era Ltd (5%)
17.93%
Quarterly Results Snapshot (Consolidated) - Sep'25 - QoQ

QoQ Growth in quarter ended Sep 2025 is -12.07% vs 2.99% in Jun 2025
QoQ Growth in quarter ended Sep 2025 is -45.84% vs 0.54% in Jun 2025
Half Yearly Results Snapshot (Consolidated) - Sep'25

Growth in half year ended Sep 2025 is 7.15% vs 0.71% in Sep 2024
Growth in half year ended Sep 2025 is -19.67% vs 8.31% in Sep 2024
Nine Monthly Results Snapshot (Consolidated) - Dec'24
YoY Growth in nine months ended Dec 2024 is 11.89% vs 6.62% in Dec 2023
YoY Growth in nine months ended Dec 2024 is 16.72% vs -8.77% in Dec 2023
Annual Results Snapshot (Consolidated) - Mar'25
YoY Growth in year ended Mar 2025 is 6.06% vs 14.31% in Mar 2024
YoY Growth in year ended Mar 2025 is -0.62% vs 9.45% in Mar 2024
About ABM Knowledgeware Ltd

Company Coordinates


