
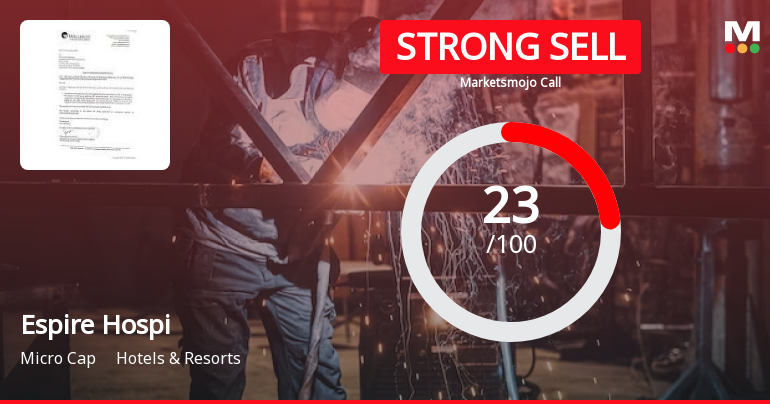
Dashboard
Poor Management Efficiency with a low ROCE of 4.26%
- The company has been able to generate a Return on Capital Employed (avg) of 4.26% signifying low profitability per unit of total capital (equity and debt)
High Debt Company with a Debt to Equity ratio (avg) at 8.60 times
With ROCE of 8.9, it has a Expensive valuation with a 3.4 Enterprise value to Capital Employed
Underperformed the market in the last 1 year
Stock DNA
Hotels & Resorts
INR 438 Cr (Micro Cap)
146.00
28
0.00%
3.18
7.66%
10.88
Total Returns (Price + Dividend) 
Espire Hospi for the last several years.
Risk Adjusted Returns v/s
Returns Beta

News
Espire Hospi's Evaluation Revised Amid Challenging Financial and Market Conditions
Espire Hospi, a microcap player in the Hotels & Resorts sector, has experienced a revision in its evaluation metrics reflecting ongoing challenges in its financial health and market performance. The recent assessment highlights shifts across key parameters including quality, valuation, financial trends, and technical outlook, providing investors with a clearer understanding of the company’s current standing.
Read More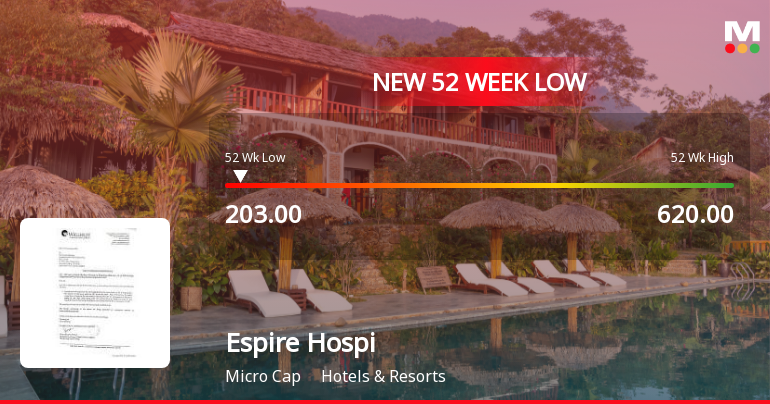
Espire Hospitality Stock Falls to 52-Week Low of Rs.203
Espire Hospitality’s shares touched a fresh 52-week low of Rs.203 today, marking a significant decline amid broader market fluctuations and company-specific financial indicators. The stock’s performance contrasts with the broader Sensex, which remains near its 52-week high.
Read More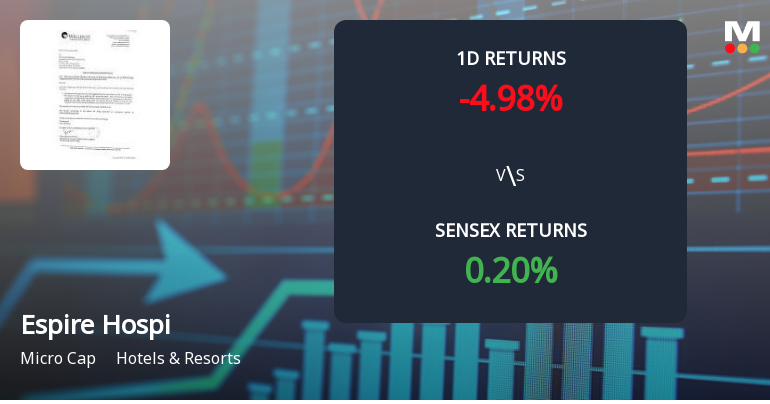
Espire Hospitality Faces Intense Selling Pressure Amid Prolonged Downtrend
Espire Hospitality Ltd is currently experiencing severe selling pressure, with the stock hitting a lower circuit and a complete absence of buyers in the queue. This distress selling signals a challenging phase for the company within the Hotels & Resorts sector, as it continues to underperform against key market benchmarks.
Read More Announcements
Board Meeting Outcome for Outcome Of Board Meeting
10-Dec-2025 | Source : BSEAS PER INTIMATION ATTACHED
Announcement under Regulation 30 (LODR)-Newspaper Publication
16-Nov-2025 | Source : BSEAS PER INTIMATION ATTACHED
Board Meeting Outcome for OUTCOME OF BOARD MEETING
14-Nov-2025 | Source : BSEAS PER INTIMATION ATTACHED
Corporate Actions

No Upcoming Board Meetings

No Dividend history available

No Splits history available

No Bonus history available

No Rights history available
Quality key factors
Valuation key factors
Technicals key factors
 Technical Indicator Scale: Bearish, Mildly Bearish, Sideways, Mildly Bullish, Bullish Turned
 Shareholding Snapshot : Sep 2025
Shareholding Compare (%holding)
Promoters
None
Held by 0 Schemes
Held by 1 FIIs (2.08%)
Amit Rai (69.25%)
Rajesh Kumar Gupta (6.96%)
17.82%
Quarterly Results Snapshot (Standalone) - Sep'25 - QoQ

QoQ Growth in quarter ended Sep 2025 is -40.40% vs -21.95% in Jun 2025
QoQ Growth in quarter ended Sep 2025 is -499.30% vs -68.15% in Jun 2025
Half Yearly Results Snapshot (Standalone) - Sep'25
Growth in half year ended Sep 2025 is 37.04% vs 156.46% in Sep 2024
Growth in half year ended Sep 2025 is -533.33% vs 10.00% in Sep 2024
Nine Monthly Results Snapshot (Standalone) - Dec'24

YoY Growth in nine months ended Dec 2024 is 202.09% vs 144.65% in Dec 2023
YoY Growth in nine months ended Dec 2024 is 111.17% vs 1,018.75% in Dec 2023
Annual Results Snapshot (Standalone) - Mar'25
YoY Growth in year ended Mar 2025 is 234.31% vs 91.74% in Mar 2024
YoY Growth in year ended Mar 2025 is 223.05% vs 814.29% in Mar 2024
About Espire Hospitality Ltd

Company Coordinates


