
Total Returns (Price + Dividend) 
SC Agrotech for the last several years.
Risk Adjusted Returns v/s
Returns Beta

News
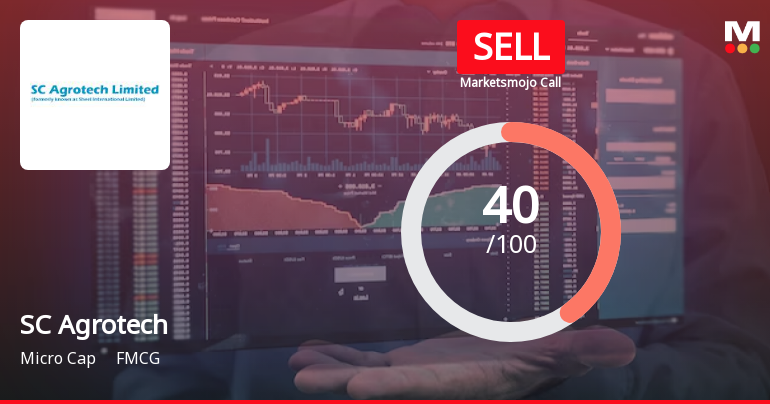
SC Agrotech Ltd is Rated Sell
SC Agrotech Ltd is rated 'Sell' by MarketsMOJO, with this rating last updated on 08 Dec 2025. However, the analysis and financial metrics discussed here reflect the stock's current position as of 26 December 2025, providing investors with the most up-to-date insight into the company’s performance and outlook.
Read More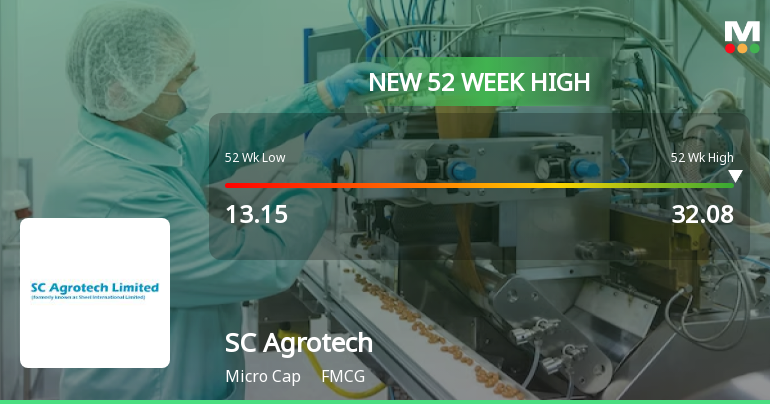
SC Agrotech Hits New 52-Week High of Rs.32.08, Marking Significant Rally
SC Agrotech, a key player in the FMCG sector, reached a new 52-week and all-time high of Rs.32.08 today, reflecting a sustained upward momentum that has captured market attention. The stock's performance over the past 15 trading sessions has been notably strong, with a cumulative return exceeding 106%, underscoring a remarkable rally in a challenging market environment.
Read More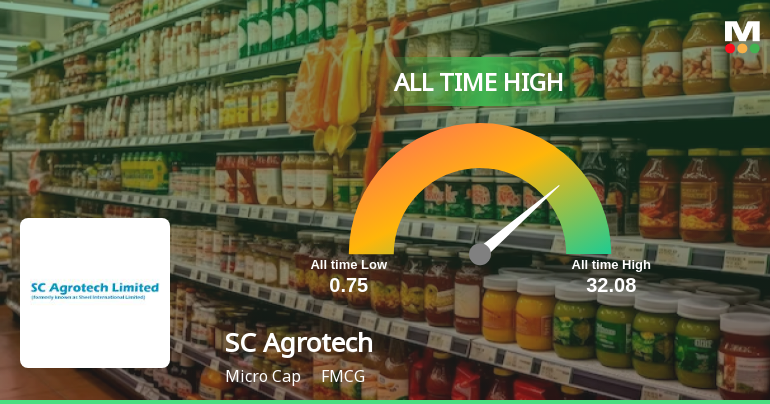
SC Agrotech Hits All-Time High at Rs.32.08, Marking a Significant Milestone
SC Agrotech, a prominent player in the FMCG sector, reached a new all-time high of Rs.32.08 today, reflecting a remarkable phase of sustained growth and market performance. This milestone underscores the company’s notable journey over recent months and years, highlighted by consistent gains and strong comparative returns against benchmark indices.
Read More Announcements
Announcement under Regulation 30 (LODR)-Allotment
03-Dec-2025 | Source : BSEAllotment of 70000000 Fully Convertible Equity warrants to allottees on December 03 2025
Board Meeting Outcome for Outcome Of The Board Meeting Held Today I.E. December 03 2025 For Allotment Of Warrants
03-Dec-2025 | Source : BSEAllotment of 70000000 (Seven Crore) Fully Convertible Equity Warrants convertible into Equity Shares to 19 allottees.
Announcement Under Regulation 30 (LODR) Regulations - Compliance With The BSE Notice 20221213-47 Dated 13/12/2022
26-Nov-2025 | Source : BSEAnnouncement under Regulation 30 (LODR) Regulation- Compliance with the BSE notice 20221213-47 dated 13/12/2022
Corporate Actions

No Upcoming Board Meetings

No Dividend history available

No Splits history available

No Bonus history available

No Rights history available
Quality key factors
Valuation key factors
Technicals key factors
 Technical Indicator Scale: Bearish, Mildly Bearish, Sideways, Mildly Bullish, Bullish Turned
 Shareholding Snapshot : Sep 2025
Shareholding Compare (%holding)
Non Institution
None
Held by 0 Schemes
Held by 0 FIIs
None
Jivaib Trading Private Limited (20.33%)
68.97%
Quarterly Results Snapshot (Standalone) - Sep'25 - YoY

YoY Growth in quarter ended Sep 2025 is 0.00% vs -100.00% in Sep 2024
YoY Growth in quarter ended Sep 2025 is 210.53% vs -2,000.00% in Sep 2024
Half Yearly Results Snapshot (Standalone) - Sep'25
Growth in half year ended Sep 2025 is 0.00% vs -100.00% in Sep 2024
Growth in half year ended Sep 2025 is 2,200.00% vs -66.67% in Sep 2024
Nine Monthly Results Snapshot (Standalone) - Dec'24

YoY Growth in nine months ended Dec 2024 is -100.00% vs -22.22% in Dec 2023
YoY Growth in nine months ended Dec 2024 is 578.57% vs -92.05% in Dec 2023
Annual Results Snapshot (Standalone) - Mar'25
YoY Growth in year ended Mar 2025 is 263.24% vs 655.56% in Mar 2024
YoY Growth in year ended Mar 2025 is -20.83% vs -87.94% in Mar 2024
About SC Agrotech Ltd

Company Coordinates


