
Dashboard
Company's ability to service its debt is weak with a poor EBIT to Interest (avg) ratio of 1.79
- Company's ability to service its debt is weak with a poor EBIT to Interest (avg) ratio of 1.79
Poor long term growth as Operating profit has grown by an annual rate -17.44% of over the last 5 years
Flat results in Sep 25
With ROCE of 4.7, it has a Very Expensive valuation with a 19.7 Enterprise value to Capital Employed
Despite the size of the company, domestic mutual funds hold only 0.39% of the company
Stock DNA
Fertilizers
INR 57,589 Cr (Mid Cap)
632.00
25
0.02%
1.17
6.60%
41.21
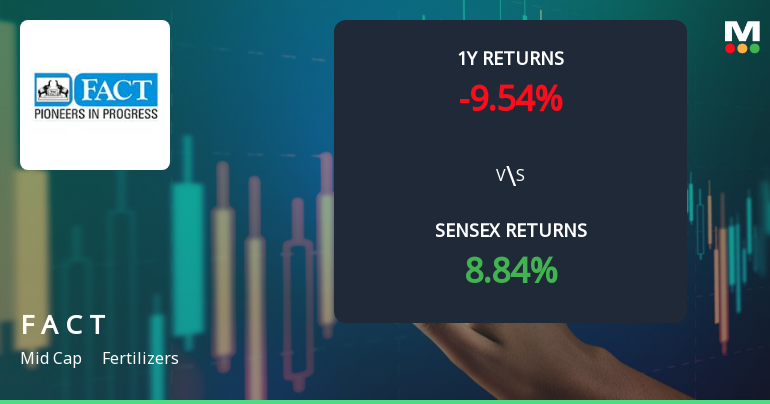
Total Returns (Price + Dividend) 
Latest dividend: 0.2 per share ex-dividend date: Sep-19-2025
Risk Adjusted Returns v/s
Returns Beta

News
Fertilizers & Chemicals Travancore Faces Bearish Momentum Amid Mixed Technical Signals
Fertilizers & Chemicals Travancore (FACT) has experienced a shift in its technical momentum, with recent evaluation adjustments indicating a bearish trend across multiple timeframes. Despite some bullish signals in volume-based indicators, the overall technical landscape suggests caution for investors as the stock navigates a challenging phase in the fertilizers sector.
Read More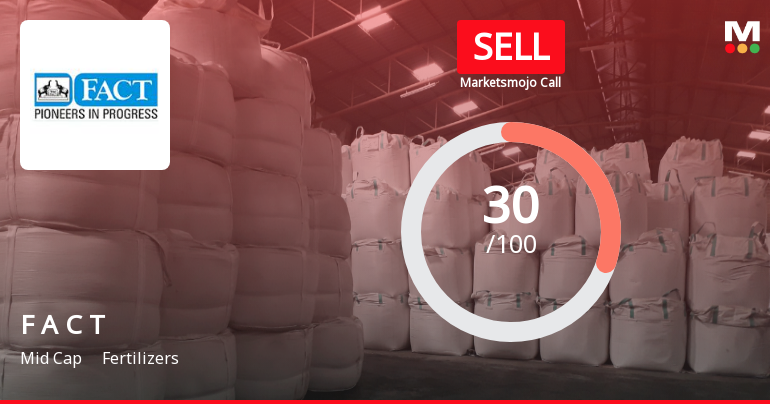
Fertilizers & Chemicals Travancore Faces Shift in Market Assessment Amidst Mixed Financial and Technical Signals
Fertilizers & Chemicals Travancore (FACT) has experienced a notable revision in its market evaluation, reflecting a complex interplay of financial performance, valuation metrics, and technical indicators. This shift comes amid subdued quarterly results and evolving technical trends, prompting a reassessment of the company’s standing within the fertilizers sector.
Read More
Fertilizers & Chemicals Travancore Faces Shift in Technical Momentum Amid Mixed Market Signals
Fertilizers & Chemicals Travancore (FACT) has experienced a notable shift in its technical momentum, with recent evaluation adjustments indicating a transition from a sideways trend to a bearish outlook. This development comes amid a complex interplay of technical indicators, including MACD, RSI, moving averages, and Bollinger Bands, which collectively paint a nuanced picture of the stock’s near-term trajectory.
Read More Announcements
Clarification sought from Fertilizers and Chemicals Travancore Ltd
17-Dec-2025 | Source : BSEThe Exchange has sought clarification from Fertilizers and Chemicals Travancore Ltd on December 17 2025 with reference to Movement in Volume.
The reply is awaited.
Clarification sought from Fertilizers and Chemicals Travancore Ltd
16-Jul-2025 | Source : BSEThe Exchange has sought clarification from Fertilizers and Chemicals Travancore Ltd on July 16 2025 with reference to Movement in Volume.
The reply is awaited.
Clarification sought from Fertilizers and Chemicals Travancore Ltd
04-Jun-2025 | Source : BSEThe Exchange has sought clarification from Fertilizers and Chemicals Travancore Ltd on June 04 2025 with reference to Movement in Volume.
The reply is awaited.
Corporate Actions

No Upcoming Board Meetings

Fertilizers & Chemicals Travancore Ltd has declared 2% dividend, ex-date: 19 Sep 25

No Splits history available

No Bonus history available

No Rights history available
Quality key factors
Valuation key factors
Technicals key factors
 Technical Indicator Scale: Bearish, Mildly Bearish, Sideways, Mildly Bullish, Bullish Turned
 Shareholding Snapshot : Sep 2025
Shareholding Compare (%holding)
Promoters
None
Held by 41 Schemes (0.04%)
Held by 28 FIIs (0.21%)
The President of India (90.0%)
None
0.71%
Quarterly Results Snapshot (Consolidated) - Sep'25 - QoQ

QoQ Growth in quarter ended Sep 2025 is 56.25% vs -1.00% in Jun 2025
QoQ Growth in quarter ended Sep 2025 is 387.38% vs -93.95% in Jun 2025
Half Yearly Results Snapshot (Consolidated) - Sep'25
Growth in half year ended Sep 2025 is 30.46% vs -29.27% in Sep 2024
Growth in half year ended Sep 2025 is 167.06% vs -121.17% in Sep 2024
Nine Monthly Results Snapshot (Consolidated) - Dec'24

YoY Growth in nine months ended Dec 2024 is -24.93% vs -19.32% in Dec 2023
YoY Growth in nine months ended Dec 2024 is -114.22% vs -53.65% in Dec 2023
Annual Results Snapshot (Consolidated) - Mar'25
YoY Growth in year ended Mar 2025 is -19.86% vs -18.44% in Mar 2024
YoY Growth in year ended Mar 2025 is -71.79% vs -76.15% in Mar 2024
About Fertilizers & Chemicals Travancore Ltd

Company Coordinates


