
Dashboard
Weak Long Term Fundamental Strength as the company has not declared results in the last 6 months
- Poor long term growth as Net Sales has grown by an annual rate of -15.18% and Operating profit at -45.07% over the last 5 years
- High Debt Company with a Debt to Equity ratio (avg) at 5.67 times
The company has declared Negative results for the last 3 consecutive quarters
Risky - Negative EBITDA
Stock DNA
Plastic Products - Industrial
INR 65 Cr (Small Cap)
NA (Loss Making)
37
0.00%
2.61
-164.00%
65.07
Total Returns (Price + Dividend) 
CDG Petchem for the last several years.
Risk Adjusted Returns v/s
Returns Beta

News
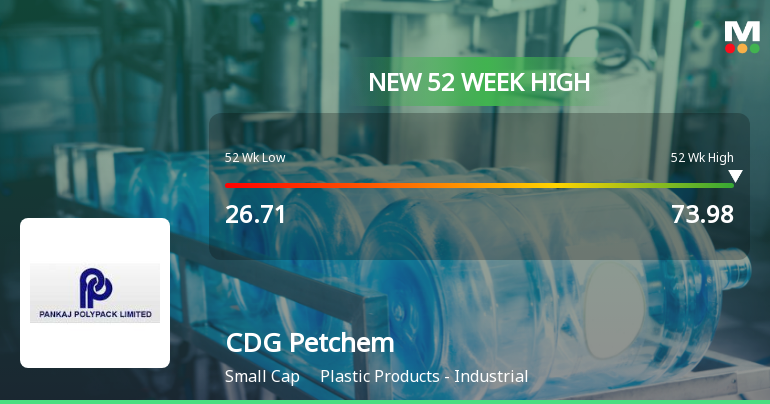
CDG Petchem Hits New 52-Week High at Rs.73.98, Marking Significant Milestone
CDG Petchem has reached a new 52-week high of Rs.73.98, reflecting a notable surge in its stock price and marking a key milestone for the plastic products industrial sector player. This achievement underscores the stock’s strong momentum amid a broadly positive market environment.
Read More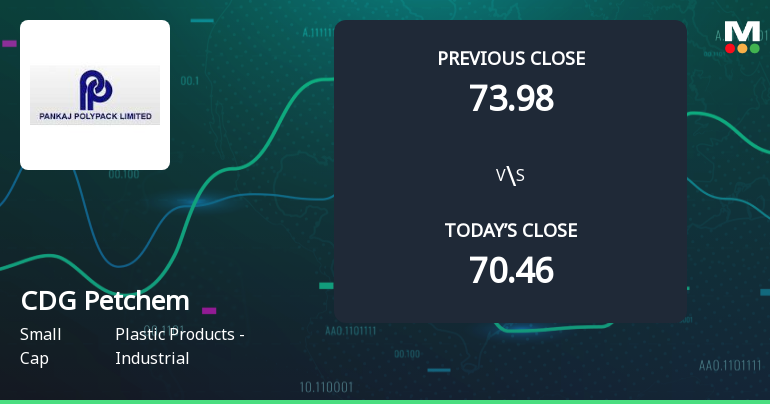
CDG Petchem Opens with Strong Gap Up, Reflecting Positive Market Momentum
CDG Petchem commenced trading today with a notable gap up, opening at ₹73.98, marking a 5.0% rise from its previous close and reaching a new 52-week and all-time high. This strong start underscores a positive market sentiment surrounding the stock within the Plastic Products - Industrial sector.
Read More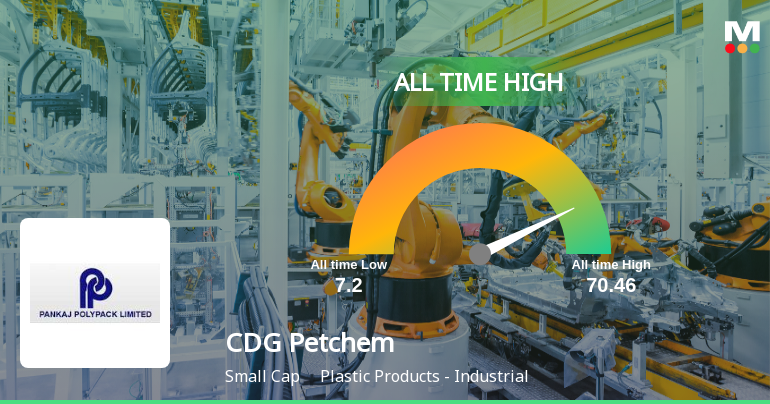
CDG Petchem Stock Hits All-Time High at Rs.73.98, Marking a Significant Milestone
CDG Petchem, a key player in the Plastic Products - Industrial sector, reached a new all-time high of Rs.73.98 today, reflecting a notable phase in its market journey. The stock’s performance over recent months highlights a sustained upward trajectory, underscoring its evolving position within the industry.
Read More Announcements
Acqusition Of 51% Of Post-Issue Share Capital Of Jujhar Logistic And Travels Limited
18-Nov-2025 | Source : BSEThe Company has acquired 51% of the post issue share capital of Jujhar Logistic and Travels Limited by subscribing to 10410 Equity Shares of the said Company. Consequently Jujhar Logistic and Travels Limited has become a subsidiary of CDG Petchem Limited
Recommendations of the Committee of ID under Reg 26(7) of SEBI (SAST) Regulations 2011
07-Oct-2025 | Source : BSERecommendation of the Committee of Independent Directors (IDC) on the Open Offer to the Equity Shareholders of CDG Petchem Limited (Target Company).
Letter of Offer
03-Oct-2025 | Source : BSEFintellectual Corporate Advisors Pvt Ltd (Manager to the offer) has submitted to BSE a copy of Letter of Offer to the public shareholders of CDG Petchem Ltd (Target Company).
Corporate Actions

No Upcoming Board Meetings

No Dividend history available

No Splits history available

No Bonus history available

No Rights history available
Quality key factors
Valuation key factors
Technicals key factors
 Technical Indicator Scale: Bearish, Mildly Bearish, Sideways, Mildly Bullish, Bullish Turned
 Shareholding Snapshot : Dec 2024
Shareholding Compare (%holding)
Promoters
None
Held by 0 Schemes
Held by 0 FIIs
Taradevi Dugar (12.0%)
Anisha Fincap Consultants Llp (10.44%)
21.41%
Quarterly Results Snapshot (Standalone) - Mar'25 - YoY

YoY Growth in quarter ended Mar 2025 is -13.58% vs -54.39% in Mar 2024

YoY Growth in quarter ended Mar 2025 is -9.09% vs 58.49% in Mar 2024
Half Yearly Results Snapshot (Consolidated) - Sep'24
Growth in half year ended Sep 2024 is -44.44% vs -19.34% in Sep 2023
Growth in half year ended Sep 2024 is 0.00% vs 100.00% in Sep 2023
Nine Monthly Results Snapshot (Consolidated) - Dec'24
YoY Growth in nine months ended Dec 2024 is -46.23% vs -10.42% in Dec 2023
YoY Growth in nine months ended Dec 2024 is -60.78% vs -418.75% in Dec 2023
Annual Results Snapshot (Standalone) - Mar'25
YoY Growth in year ended Mar 2025 is -41.62% vs -35.32% in Mar 2024
YoY Growth in year ended Mar 2025 is -15.22% vs -124.39% in Mar 2024
About CDG Petchem Ltd

Company Coordinates


