
Dashboard
Weak Long Term Fundamental Strength with an average Return on Capital Employed (ROCE) of 1.77%
- Poor long term growth as Net Sales has grown by an annual rate of 14.87% over the last 5 years
- Low ability to service debt as the company has a high Debt to EBITDA ratio of 4.92 times
Flat results in Sep 25
With ROCE of 8.6, it has a Very Expensive valuation with a 0.8 Enterprise value to Capital Employed
Total Returns (Price + Dividend) 
Jainco Projects for the last several years.
Risk Adjusted Returns v/s
Returns Beta

News

Jainco Projects (India) Sees Shift in Market Assessment Amid Mixed Financial and Technical Signals
Jainco Projects (India), a player in the Trading & Distributors sector, has experienced a notable revision in its market evaluation following a detailed analysis of its financial performance, valuation metrics, and technical indicators. Despite some positive returns relative to the broader market, the company’s recent quarterly results and technical trends have contributed to a nuanced reassessment of its investment profile.
Read More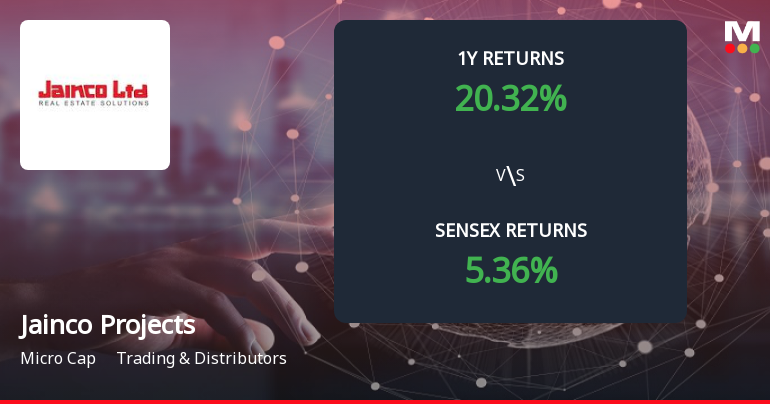
Jainco Projects (India) Forms Death Cross, Signalling Potential Bearish Trend
Jainco Projects (India), a micro-cap player in the Trading & Distributors sector, has recently formed a Death Cross, a technical pattern where the 50-day moving average crosses below the 200-day moving average. This development often signals a shift towards a bearish trend and suggests a potential weakening in the stock’s medium to long-term momentum.
Read More
Jainco Projects (India) Sees Shift in Market Assessment Amid Mixed Financial and Technical Signals
Jainco Projects (India), a player in the Trading & Distributors sector, has experienced a revision in its market assessment driven by nuanced changes across quality, valuation, financial trends, and technical indicators. While the company’s stock performance continues to outpace broader market indices over the past year, underlying financial metrics and technical signals present a complex picture for investors to consider.
Read More Announcements
Intimation About Event And Information Defined Under Schedule III / Regulation 30 Ref.: Events In Relation To Imposition Of Fine By BSE Limited Stating Noncompliance Of Regulation 44(3) Of LODR
22-Dec-2025 | Source : BSEIntimation about fine levied by BSE due to non compliance of LODR provision
Board Meeting Outcome for Financial Results As On 30/09/2025
14-Nov-2025 | Source : BSEoutcome of board meeting and adoption of unaudited financial results as on 30/09/2025
Exemption Under 15(2) Of SEBI LODR And Non Applicability Of 23(9) Of LODR
14-Nov-2025 | Source : BSEletter enclosed
Corporate Actions

No Upcoming Board Meetings

No Dividend history available

No Splits history available

No Bonus history available

No Rights history available
Quality key factors
Valuation key factors
Technicals key factors
 Technical Indicator Scale: Bearish, Mildly Bearish, Sideways, Mildly Bullish, Bullish Turned
 Shareholding Snapshot : Sep 2025
Shareholding Compare (%holding)
Non Institution
None
Held by 0 Schemes
Held by 0 FIIs
Newmony Textiles (p) Ltd (4.5%)
Arp Commercial Services Llp (4.94%)
31.98%
Quarterly Results Snapshot (Standalone) - Sep'25 - QoQ

QoQ Growth in quarter ended Sep 2025 is -75.00% vs -48.15% in Jun 2025

QoQ Growth in quarter ended Sep 2025 is 0.00% vs -100.00% in Jun 2025
Half Yearly Results Snapshot (Standalone) - Sep'25
Growth in half year ended Sep 2025 is 483.33% vs 0.00% in Sep 2024
Growth in half year ended Sep 2025 is 100.00% vs -66.67% in Sep 2024
Nine Monthly Results Snapshot (Standalone) - Dec'24
YoY Growth in nine months ended Dec 2024 is 137.50% vs 14.29% in Dec 2023
YoY Growth in nine months ended Dec 2024 is 33.33% vs 0.00% in Dec 2023
Annual Results Snapshot (Standalone) - Mar'25
YoY Growth in year ended Mar 2025 is 231.82% vs -21.43% in Mar 2024
YoY Growth in year ended Mar 2025 is 0.00% vs -100.00% in Mar 2024
About Jainco Projects (India) Ltd

Company Coordinates


