
Dashboard
With a Negative Book Value, the company has a Weak Long Term Fundamental Strength
- Low ability to service debt as the company has a high Debt to EBITDA ratio of 9.60 times
- The company has been able to generate a Return on Equity (avg) of 3.89% signifying low profitability per unit of shareholders funds
Risky - Negative Operating Profits
Stock DNA
Telecom - Services
INR 130,337 Cr (Mid Cap)
NA (Loss Making)
40
0.00%
-2.79
31.46%
-1.58
Total Returns (Price + Dividend) 
Latest dividend: 0.6 per share ex-dividend date: Sep-22-2016
Risk Adjusted Returns v/s
Returns Beta

News

Vodafone Idea Ltd. Sees High Value Trading Amidst Market Volatility
Vodafone Idea Ltd. has emerged as one of the most actively traded stocks by value on 26 December 2025, reflecting significant investor interest despite a marginal dip in its share price. The telecom services company recorded a total traded volume exceeding 25 crore shares, with a turnover surpassing ₹30,257 lakhs, underscoring its prominence in the mid-cap segment amid a fluctuating market environment.
Read More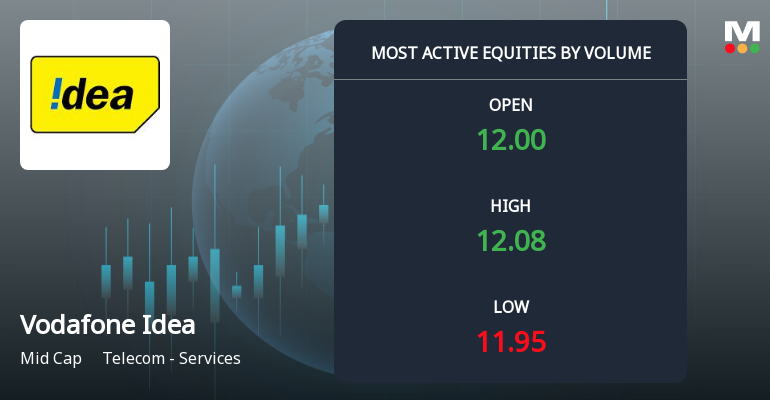
Vodafone Idea Sees Exceptional Trading Volume Amidst Market Activity
Vodafone Idea Ltd. has emerged as one of the most actively traded stocks in the telecom sector, registering a remarkable volume of over 10.5 crore shares on 26 December 2025. This surge in trading activity reflects heightened market interest and notable price movements, positioning the stock close to its 52-week high amid a backdrop of sectoral and broader market fluctuations.
Read More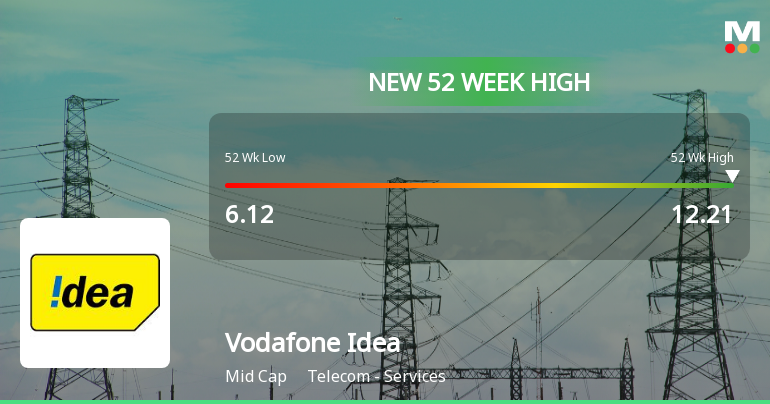
Announcements
Intimation Pursuant To Regulation 30 Of The SEBI Listing Regulations 2015
22-Dec-2025 | Source : BSEDisclosure under Regulation 30 of SEBI (Listing Obligations and Disclosure Requirements) Regulations 2015 regarding order passed under the Central Goods and Services Tax Act 2017
Intimation Pursuant To Regulation 30 Of The SEBI Listing Regulations 2015
19-Dec-2025 | Source : BSEDisclosure under Regulation 30 of SEBI (Listing Obligations and Disclosure Requirements) Regulations 2015 regarding order passed under Central Goods and Services Tax Act 2017
Announcement Under Regulation 30 Of SEBI (Listing Obligations And Disclosure Requirements) Regulations 2015
18-Dec-2025 | Source : BSERelease being issued to media for Issuance of Non-Convertible Debentures aggregating to Rs. 3300 Crore by Vodafone Idea Telecom Infrastructure Limited Wholly owned subsidiary of the Company
Corporate Actions

No Upcoming Board Meetings

Vodafone Idea Ltd. has declared 6% dividend, ex-date: 22 Sep 16

No Splits history available

No Bonus history available

Vodafone Idea Ltd. has announced 87:38 rights issue, ex-date: 29 Mar 19
Quality key factors
Valuation key factors
Technicals key factors
 Technical Indicator Scale: Bearish, Mildly Bearish, Sideways, Mildly Bullish, Bullish Turned
 Shareholding Snapshot : Sep 2025
Shareholding Compare (%holding)
Promoters
None
Held by 33 Schemes (4.55%)
Held by 442 FIIs (5.99%)
Euro Pacific Securities Ltd (5.16%)
Department Of Investment And Public Asset Management (49%)
12.2%
Quarterly Results Snapshot (Consolidated) - Sep'25 - QoQ

QoQ Growth in quarter ended Sep 2025 is 1.56% vs 0.08% in Jun 2025
QoQ Growth in quarter ended Sep 2025 is 16.40% vs 7.79% in Jun 2025
Half Yearly Results Snapshot (Consolidated) - Sep'25
Growth in half year ended Sep 2025 is 3.62% vs 0.32% in Sep 2024

Growth in half year ended Sep 2025 is 10.84% vs 17.91% in Sep 2024
Nine Monthly Results Snapshot (Consolidated) - Dec'24
YoY Growth in nine months ended Dec 2024 is 1.60% vs 1.26% in Dec 2023
YoY Growth in nine months ended Dec 2024 is 14.20% vs -2.98% in Dec 2023
Annual Results Snapshot (Consolidated) - Mar'25
YoY Growth in year ended Mar 2025 is 2.16% vs 1.13% in Mar 2024
YoY Growth in year ended Mar 2025 is 12.34% vs -6.61% in Mar 2024
About Vodafone Idea Ltd.

Company Coordinates


