
Dashboard
With a fall in Net Profit of -67.34%, the company declared Very Negative results in Sep 25
- The company has declared negative results for the last 3 consecutive quarters
- The company has declared negative results in Mar 25 after 2 consecutive negative quarters
- OPERATING PROFIT TO INTEREST(Q) Lowest at 8.98 times
- PAT(Q) At Rs 4.27 cr has Fallen at -67.3% (vs previous 4Q average)
- NET SALES(Q) At Rs 55.42 cr has Fallen at -11.1% (vs previous 4Q average)
With ROE of 10.4, it has a Very Expensive valuation with a 13.1 Price to Book Value
Despite the size of the company, domestic mutual funds hold only 0% of the company
Stock DNA
Aerospace & Defense
INR 4,289 Cr (Small Cap)
126.00
33
0.12%
-0.06
10.40%
13.23
Total Returns (Price + Dividend) 
Latest dividend: 0.2 per share ex-dividend date: Jun-12-2025
Risk Adjusted Returns v/s
Returns Beta

News

Avantel's Market Assessment Shifts Amid Mixed Financial and Technical Signals
Avantel, a key player in the Aerospace & Defense sector, has experienced a revision in its market evaluation reflecting a complex interplay of technical indicators, valuation metrics, financial trends, and broader market context. This article analyses the factors influencing the recent shift in the company’s assessment, providing investors with a comprehensive understanding of Avantel’s current position.
Read More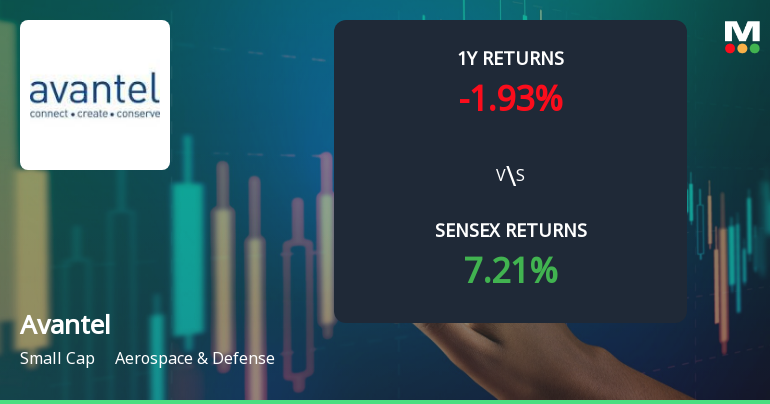
Avantel's Technical Momentum Shifts Amid Mixed Market Signals
Avantel, a key player in the Aerospace & Defense sector, has exhibited a subtle shift in its technical momentum, reflecting a nuanced market assessment. Recent price movements and technical indicators reveal a complex interplay of bullish and bearish signals, suggesting cautious investor sentiment as the stock navigates current market conditions.
Read More
Avantel’s Market Assessment Reflects Challenges Amid Mixed Technical and Financial Signals
Avantel, a key player in the Aerospace & Defense sector, has experienced a shift in market evaluation driven by a combination of technical indicators, valuation metrics, financial trends, and broader market context. This article analyses the factors influencing the recent changes in the company’s assessment, providing investors with a comprehensive understanding of its current standing.
Read More Announcements
Intimation Of Grant Of Stock Options Under Avantel Employees Stock Option Plan 2023 (ESOP 2023)
22-Dec-2025 | Source : BSEGrant of Stock Options under ESOP 2023
Announcement under Regulation 30 (LODR)-Allotment of ESOP / ESPS
22-Dec-2025 | Source : BSEAllotment of ESOP
Announcement under Regulation 30 (LODR)-Award_of_Order_Receipt_of_Order
13-Dec-2025 | Source : BSEReceipt of Purchase Order worth of Rs.13.82 Crores
Corporate Actions

No Upcoming Board Meetings

Avantel Ltd has declared 10% dividend, ex-date: 12 Jun 25

Avantel Ltd has announced 2:10 stock split, ex-date: 14 Aug 23

Avantel Ltd has announced 2:1 bonus issue, ex-date: 24 Nov 23

Avantel Ltd has announced 10:121 rights issue, ex-date: 07 May 25
Quality key factors
Valuation key factors
Technicals key factors
 Technical Indicator Scale: Bearish, Mildly Bearish, Sideways, Mildly Bullish, Bullish Turned
 Shareholding Snapshot : Sep 2025
Shareholding Compare (%holding)
Non Institution
None
Held by 0 Schemes
Held by 35 FIIs (0.67%)
Vidyasagar Abburi (16.98%)
K.swapna (2.46%)
51.79%
Quarterly Results Snapshot (Consolidated) - Sep'25 - QoQ

QoQ Growth in quarter ended Sep 2025 is 6.76% vs 5.38% in Jun 2025
QoQ Growth in quarter ended Sep 2025 is 32.20% vs -46.88% in Jun 2025
Half Yearly Results Snapshot (Consolidated) - Sep'25

Growth in half year ended Sep 2025 is -16.91% vs 4.79% in Sep 2024
Growth in half year ended Sep 2025 is -75.23% vs 25.75% in Sep 2024
Nine Monthly Results Snapshot (Consolidated) - Dec'24
YoY Growth in nine months ended Dec 2024 is 9.45% vs 79.17% in Dec 2023
YoY Growth in nine months ended Dec 2024 is 24.65% vs 134.88% in Dec 2023
Annual Results Snapshot (Consolidated) - Mar'25
YoY Growth in year ended Mar 2025 is 11.04% vs 45.27% in Mar 2024
YoY Growth in year ended Mar 2025 is 7.40% vs 95.79% in Mar 2024
About Avantel Ltd

Company Coordinates


