
Dashboard
Strong Long Term Fundamental Strength with an average Return on Equity (ROE) of 21.92%
- Healthy long term growth as Net Sales has grown by an annual rate of 27.99% and Operating profit at 39.50%
- Company has a low Debt to Equity ratio (avg) at 0 times
With a growth in Net Profit of 10.95%, the company declared Very Positive results in Sep 25
High Institutional Holdings at 51.84%
Stock DNA
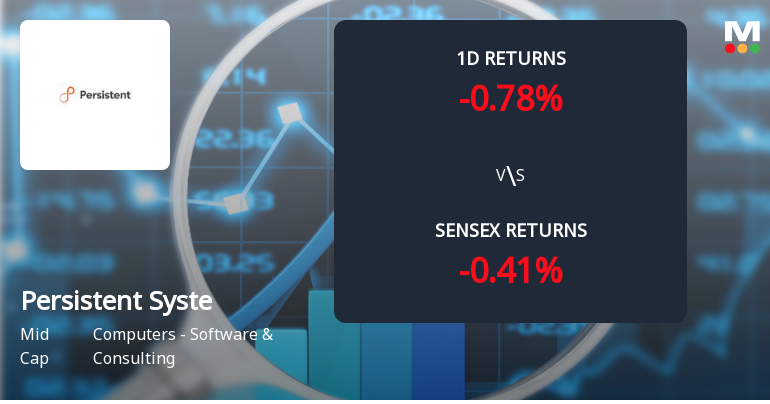
Computers - Software & Consulting
INR 100,302 Cr (Mid Cap)
60.00
29
0.55%
-0.20
23.30%
14.02
Total Returns (Price + Dividend) 
Latest dividend: 15 per share ex-dividend date: Jul-14-2025
Risk Adjusted Returns v/s
Returns Beta

News
Persistent Systems Sees Notable Surge in Derivatives Open Interest Amid Market Volatility
Persistent Systems has experienced a significant rise in open interest within its derivatives segment, reflecting evolving market positioning and investor sentiment. This development comes amid a backdrop of recent price fluctuations and sector-wide movements, prompting closer examination of volume patterns and potential directional bets in the software and consulting space.
Read More
Persistent Systems Sees Shift in Market Assessment Amid Strong Financial and Technical Signals
Persistent Systems has experienced a notable revision in its market evaluation, reflecting a combination of robust financial results, evolving technical indicators, and valuation considerations. This shift highlights the company’s ongoing performance within the Computers - Software & Consulting sector and offers investors a comprehensive view of its current standing.
Read More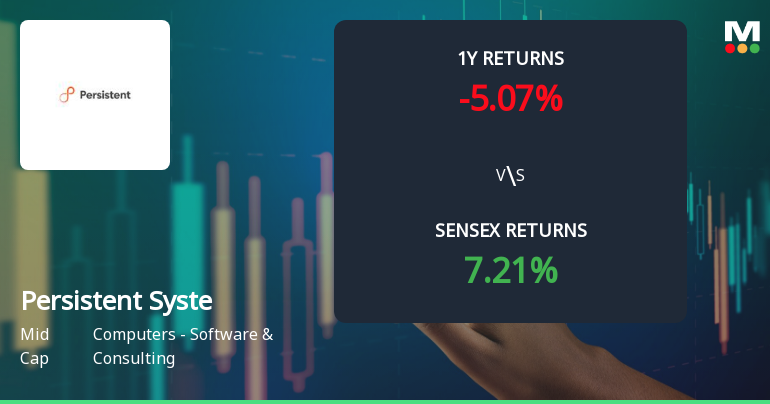
Persistent Systems Technical Momentum Shifts Signal Market Interest
Persistent Systems has exhibited a notable shift in its technical momentum, reflecting evolving market dynamics within the Computers - Software & Consulting sector. Recent evaluation adjustments highlight a transition towards a more bullish technical trend, supported by key indicators such as MACD, moving averages, and Bollinger Bands, suggesting renewed investor attention amid mixed longer-term signals.
Read More Announcements
Announcement under Regulation 30 (LODR)-Analyst / Investor Meet - Outcome
24-Dec-2025 | Source : BSEThe outcome of Investor/analyst session held on Wednesday December 24 2025 is as enclosed.
Announcement under Regulation 30 (LODR)-Updates on Acquisition
23-Dec-2025 | Source : BSEThe intimation under Reg. 30 of the SEBI (LODR) Regulations 2015 is as enclosed.
Announcement under Regulation 30 (LODR)-Analyst / Investor Meet - Outcome
19-Dec-2025 | Source : BSEThe outcome of Investor/analyst session held on Friday December 19 2025 is as enclosed.
Corporate Actions

No Upcoming Board Meetings

Persistent Systems Ltd has declared 300% dividend, ex-date: 14 Jul 25

Persistent Systems Ltd has announced 5:10 stock split, ex-date: 28 Mar 24

Persistent Systems Ltd has announced 1:1 bonus issue, ex-date: 10 Mar 15

No Rights history available
Quality key factors
Valuation key factors
Technicals key factors
 Technical Indicator Scale: Bearish, Mildly Bearish, Sideways, Mildly Bullish, Bullish Turned
 Shareholding Snapshot : Sep 2025
Shareholding Compare (%holding)
Promoters
None
Held by 41 Schemes (23.71%)
Held by 768 FIIs (21.23%)
Anand Suresh Deshpande (29.24%)
Motilal Oswal Midcap Fund (6.32%)
13.87%
Quarterly Results Snapshot (Consolidated) - Sep'25 - QoQ

QoQ Growth in quarter ended Sep 2025 is 7.41% vs 2.82% in Jun 2025
QoQ Growth in quarter ended Sep 2025 is 10.95% vs 7.37% in Jun 2025
Half Yearly Results Snapshot (Consolidated) - Sep'25
Growth in half year ended Sep 2025 is 22.72% vs 19.05% in Sep 2024
Growth in half year ended Sep 2025 is 41.97% vs 28.32% in Sep 2024
Nine Monthly Results Snapshot (Consolidated) - Dec'24
YoY Growth in nine months ended Dec 2024 is 20.27% vs 18.62% in Dec 2023
YoY Growth in nine months ended Dec 2024 is 29.07% vs 16.22% in Dec 2023
Annual Results Snapshot (Consolidated) - Mar'25
YoY Growth in year ended Mar 2025 is 21.56% vs 17.62% in Mar 2024
YoY Growth in year ended Mar 2025 is 28.05% vs 18.72% in Mar 2024
About Persistent Systems Ltd

Company Coordinates


