
Dashboard
Poor long term growth as Operating profit has grown by an annual rate -4.80% of over the last 5 years
Flat results in Sep 25
With ROE of 9, it has a Expensive valuation with a 0.8 Price to Book Value
Despite the size of the company, domestic mutual funds hold only 0.01% of the company
Consistent Underperformance against the benchmark over the last 3 years
Total Returns (Price + Dividend) 
Latest dividend: 1.5 per share ex-dividend date: Jun-30-2025
Risk Adjusted Returns v/s
Returns Beta

News
Dalmia Bharat’s Evaluation Metrics Revised Amidst Sector Challenges and Market Underperformance
Dalmia Bharat’s recent assessment has undergone a revision reflecting shifts in its fundamental and technical outlook. The changes stem from a combination of valuation concerns, subdued financial trends, and bearish technical indicators, set against a backdrop of persistent underperformance within the sugar sector and the broader market.
Read More
Dalmia Bharat Sugar & Industries: Valuation Shifts and Market Position Analysis
Dalmia Bharat Sugar & Industries has experienced notable changes in its valuation parameters, reflecting a shift in market assessment. This article examines the company’s current price-to-earnings (P/E) ratio, price-to-book value (P/BV), and other key financial metrics in comparison to historical data and peer averages within the sugar industry.
Read More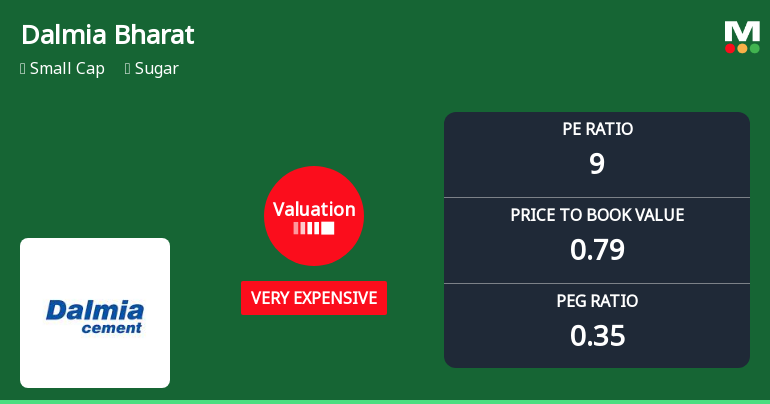
Dalmia Bharat Sugar & Industries: Valuation Shifts and Market Position Analysis
Dalmia Bharat Sugar & Industries has experienced a notable revision in its valuation parameters, reflecting a shift in market assessment within the sugar sector. This article examines the recent changes in key financial metrics such as price-to-earnings (P/E) and price-to-book value (P/BV) ratios, comparing them with historical data and peer averages to provide a comprehensive view of the stock’s price attractiveness.
Read More Announcements
Closure of Trading Window
24-Dec-2025 | Source : BSEClosure of Trading Window
Apportionment Of Cost Of Acquisition Of Equity Shares Of Dalmia Bharat Sugar And Industries Limited And Dalmia Bharat Refractories Limited.
18-Dec-2025 | Source : BSEApportionment of cost of acquisition of Equity Shares of Dalmia Bharat Sugar and Industries Limited and Dalmia Bharat Refractories Limited.
Announcement under Regulation 30 (LODR)-Credit Rating
12-Dec-2025 | Source : BSERating letter dated December 12 2025 of ICRA Limited.
Corporate Actions

No Upcoming Board Meetings

Dalmia Bharat Sugar & Industries Ltd has declared 75% dividend, ex-date: 30 Jun 25

No Splits history available

No Bonus history available

No Rights history available
Quality key factors
Valuation key factors
Technicals key factors
 Technical Indicator Scale: Bearish, Mildly Bearish, Sideways, Mildly Bullish, Bullish Turned
 Shareholding Snapshot : Sep 2025
Shareholding Compare (%holding)
Promoters
None
Held by 2 Schemes (0.0%)
Held by 54 FIIs (0.97%)
Samagama Holdings And Commercial Private Limited (44.32%)
Anil Kumar Goel (5.23%)
20.33%
Quarterly Results Snapshot (Standalone) - Sep'25 - QoQ

QoQ Growth in quarter ended Sep 2025 is 5.08% vs -7.56% in Jun 2025
QoQ Growth in quarter ended Sep 2025 is -40.59% vs -80.98% in Jun 2025
Half Yearly Results Snapshot (Standalone) - Sep'25

Growth in half year ended Sep 2025 is 3.09% vs 19.54% in Sep 2024
Growth in half year ended Sep 2025 is -41.75% vs -7.58% in Sep 2024
Nine Monthly Results Snapshot (Consolidated) - Dec'24
YoY Growth in nine months ended Dec 2024 is 26.92% vs -0.60% in Dec 2023
YoY Growth in nine months ended Dec 2024 is -0.40% vs -24.56% in Dec 2023
Annual Results Snapshot (Standalone) - Mar'25
YoY Growth in year ended Mar 2025 is 28.47% vs -10.85% in Mar 2024
YoY Growth in year ended Mar 2025 is 34.14% vs 8.96% in Mar 2024
About Dalmia Bharat Sugar & Industries Ltd

Company Coordinates


