
Dashboard
Weak Long Term Fundamental Strength with a -3.55% CAGR growth in Operating Profits over the last 5 years
- Low ability to service debt as the company has a high Debt to EBITDA ratio of 8.15 times
- The company has been able to generate a Return on Equity (avg) of 3.90% signifying low profitability per unit of shareholders funds
With a growth in Net Profit of 209.15%, the company declared Very Positive results in Sep 25
With ROCE of 10.2, it has a Fair valuation with a 4.8 Enterprise value to Capital Employed
Majority shareholders : Promoters
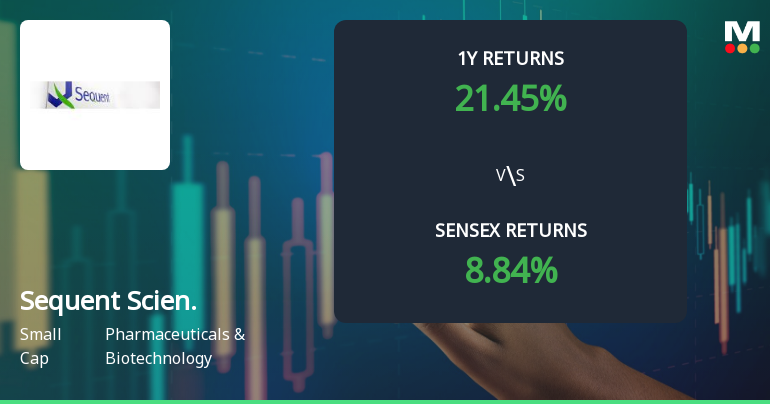
Consistent Returns over the last 3 years
Stock DNA
Pharmaceuticals & Biotechnology
INR 5,429 Cr (Small Cap)
122.00
34
0.00%
0.52
5.48%
6.70
Total Returns (Price + Dividend) 
Latest dividend: 0.5 per share ex-dividend date: Sep-08-2021
Risk Adjusted Returns v/s
Returns Beta

News
Sequent Scientific Technical Momentum Shifts Amid Mixed Market Signals
Sequent Scientific, a key player in the Pharmaceuticals & Biotechnology sector, is exhibiting a nuanced shift in its technical momentum as recent evaluation adjustments reflect a transition from a bullish to a mildly bullish trend. This development comes amid a complex interplay of technical indicators, including MACD, RSI, moving averages, and Bollinger Bands, which collectively paint a multifaceted picture of the stock’s near-term trajectory.
Read More
Sequent Scientific Shows Mixed Technical Signals Amid Price Momentum Shift
Sequent Scientific, a key player in the Pharmaceuticals & Biotechnology sector, has experienced a notable shift in its technical parameters, reflecting evolving price momentum and mixed signals from key indicators such as MACD, RSI, and moving averages. The stock’s recent price movements and technical trends offer a nuanced picture for investors analysing its near-term trajectory.
Read More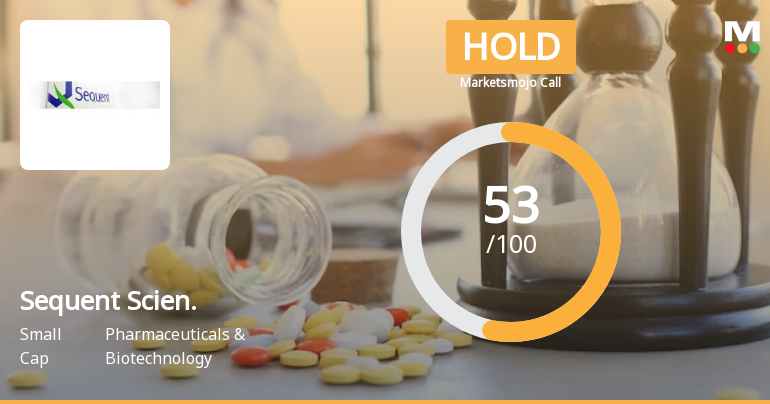
Sequent Scien. Sees Revision in Market Evaluation Amid Mixed Financial Signals
Sequent Scien., a small-cap player in the Pharmaceuticals & Biotechnology sector, has experienced a revision in its market evaluation reflecting a nuanced shift in its financial and technical outlook. This adjustment follows a period marked by contrasting performance indicators across quality, valuation, financial trends, and technical parameters.
Read More Announcements
Announcement under Regulation 30 (LODR)-Change in Management
23-Dec-2025 | Source : BSEResignation of SMP
Closure of Trading Window
19-Dec-2025 | Source : BSEClosure of Trading Window
Disclosures under Reg. 10(6) of SEBI (SAST) Regulations 2011
17-Dec-2025 | Source : BSEThe Exchange has received the disclosure under Regulation 10(6) of SEBI (Substantial Acquisition of Shares & Takeovers) Regulations 2011 for CA Hull Investments & PAC
Corporate Actions

No Upcoming Board Meetings

Sequent Scientific Ltd has declared 25% dividend, ex-date: 08 Sep 21

Sequent Scientific Ltd has announced 2:10 stock split, ex-date: 25 Feb 16

No Bonus history available

No Rights history available
Quality key factors
Valuation key factors
Technicals key factors
 Technical Indicator Scale: Bearish, Mildly Bearish, Sideways, Mildly Bullish, Bullish Turned
 Shareholding Snapshot : Dec 2025
Shareholding Compare (%holding)
Promoters
None
Held by 7 Schemes (5.85%)
Held by 39 FIIs (3.16%)
Ca Hull Investments (31.23%)
Quant Mutual Fund - Quant Small Cap Fund (5.5%)
19.24%
Quarterly Results Snapshot (Consolidated) - Sep'25 - YoY

YoY Growth in quarter ended Sep 2025 is 15.01% vs 6.56% in Sep 2024
YoY Growth in quarter ended Sep 2025 is 464.75% vs 131.15% in Sep 2024
Half Yearly Results Snapshot (Consolidated) - Sep'25
Growth in half year ended Sep 2025 is 14.04% vs 11.73% in Sep 2024
Growth in half year ended Sep 2025 is 218.53% vs 121.10% in Sep 2024
Nine Monthly Results Snapshot (Consolidated) - Dec'24
YoY Growth in nine months ended Dec 2024 is 13.99% vs -4.33% in Dec 2023
YoY Growth in nine months ended Dec 2024 is 135.93% vs -26.71% in Dec 2023
Annual Results Snapshot (Consolidated) - Mar'25
YoY Growth in year ended Mar 2025 is 13.26% vs -3.60% in Mar 2024
YoY Growth in year ended Mar 2025 is 160.98% vs 70.39% in Mar 2024
About Sequent Scientific Ltd

Company Coordinates


