
Dashboard
With ROE of 34.2, it has a Very Expensive valuation with a 7.5 Price to Book Value
- The stock is trading at a discount compared to its peers' average historical valuations
- Over the past year, while the stock has generated a return of 60.51%, its profits have risen by 349.9% ; the PEG ratio of the company is 0.1
Despite the size of the company, domestic mutual funds hold only 0.03% of the company
Stock DNA
Specialty Chemicals
INR 859 Cr (Micro Cap)
22.00
34
0.14%
-0.28
34.20%
7.62
Total Returns (Price + Dividend) 
Latest dividend: 1 per share ex-dividend date: Aug-14-2025
Risk Adjusted Returns v/s
Returns Beta

News
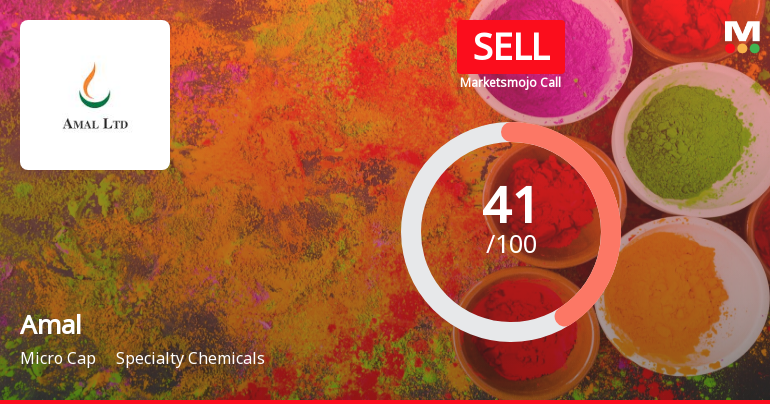
Amal Stock Evaluation Revised Amid Mixed Financial and Market Signals
Amal, a microcap player in the Specialty Chemicals sector, has experienced a revision in its market evaluation reflecting a more cautious outlook. This shift follows a detailed reassessment of the company’s financial health, valuation, technical indicators, and overall quality metrics, signalling a more guarded stance despite notable profit growth and strong year-to-date returns.
Read More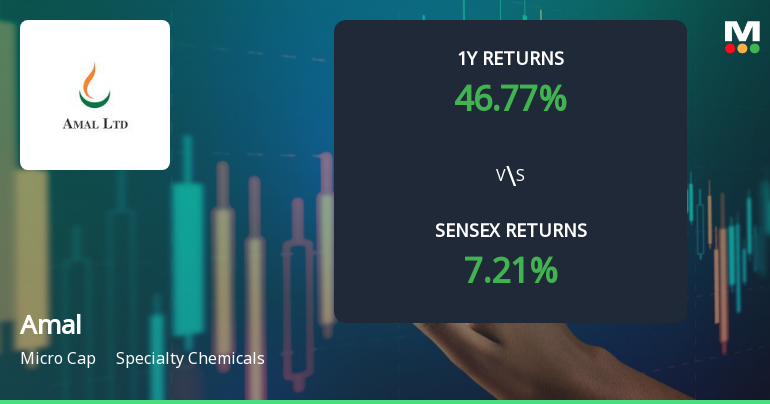
Amal Stock Analysis: Technical Momentum Shifts Amid Specialty Chemicals Sector Trends
Amal, a key player in the Specialty Chemicals sector, has exhibited notable shifts in its technical momentum, reflecting evolving market dynamics. Recent assessment changes reveal a transition in price momentum and technical indicators, offering insights into the stock’s near-term trajectory amid broader sectoral and market movements.
Read More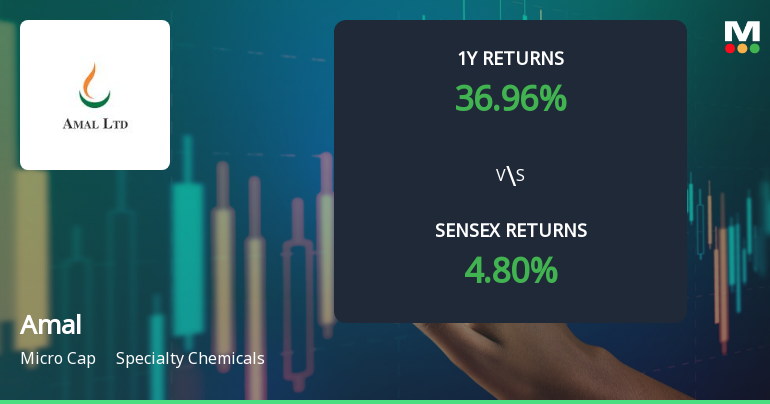
Amal Stock Analysis: Technical Momentum Shifts Signal Caution in Specialty Chemicals Sector
Amal, a key player in the specialty chemicals industry, has experienced notable shifts in its technical indicators, reflecting a change in price momentum and market sentiment. Recent data reveals a transition towards a more cautious outlook, with several technical parameters signalling a bearish trend across multiple timeframes.
Read More Announcements
Board Meeting Intimation for Meeting Of The Board Of Directors And Closure Of Trading Window On January 16 2026
24-Dec-2025 | Source : BSEAmal Ltdhas informed BSE that the meeting of the Board of Directors of the Company is scheduled on 16/01/2026 inter alia to consider and approve Pursuant to Regulation 29 of the SEBI (Listing Obligations and Disclosure Requirements) Regulations 2015 please note that the meeting of the Board of Directors of the Company will be held on Friday January 16 2026 inter alia to consider unaudited standalone and consolidated financial results for the quarter / nine months ended on December 31 2025. Pursuant to the SEBI (Prohibition of Insider Trading) Regulations 2015 trading window for trading in securities of the Company will remain closed from January 01 2026 to January 18 2026 (both days inclusive). Kindly acknowledge the receipt and inform the members of the stock exchange.
Closure of Trading Window
24-Dec-2025 | Source : BSEPursuant to Securities and Exchange Board of India (Prohibition of Insider Trading) Regulations 2015 trading window for trading in securities of the Company will remain closed for designated persons from January 01 2026 to January 18 2026 (both days inclusive) in view of the next Board meeting on January 16 2026.
Unaudited Standalone And Consolidated Financial Results With Limited Review Report For The Quarter / Six Months Ended September 30 2025
15-Oct-2025 | Source : BSEUnaudited standalone and consolidated financial results with limited review report for the quarter / six months ended September 30 2025.
Corporate Actions

16 Jan 2026

Amal Ltd has declared 10% dividend, ex-date: 14 Aug 25

No Splits history available

No Bonus history available

Amal Ltd has announced 24:77 rights issue, ex-date: 21 Feb 23
Quality key factors
Valuation key factors
Technicals key factors
 Technical Indicator Scale: Bearish, Mildly Bearish, Sideways, Mildly Bullish, Bullish Turned
 Shareholding Snapshot : Sep 2025
Shareholding Compare (%holding)
Promoters
None
Held by 3 Schemes (0.01%)
Held by 0 FIIs
Atul Finserv Limited (48.48%)
None
26.87%
Quarterly Results Snapshot (Consolidated) - Sep'25 - QoQ

QoQ Growth in quarter ended Sep 2025 is 14.14% vs 21.43% in Jun 2025
QoQ Growth in quarter ended Sep 2025 is -35.53% vs 38.64% in Jun 2025
Half Yearly Results Snapshot (Consolidated) - Sep'25

Growth in half year ended Sep 2025 is 100.38% vs 29.61% in Sep 2024
Growth in half year ended Sep 2025 is 158.96% vs 741.94% in Sep 2024
Nine Monthly Results Snapshot (Consolidated) - Dec'24
YoY Growth in nine months ended Dec 2024 is 48.50% vs 47.59% in Dec 2023
YoY Growth in nine months ended Dec 2024 is 1,579.85% vs 111.02% in Dec 2023
Annual Results Snapshot (Consolidated) - Mar'25
YoY Growth in year ended Mar 2025 is 57.18% vs 40.39% in Mar 2024
YoY Growth in year ended Mar 2025 is 1,622.94% vs 110.55% in Mar 2024
About Amal Ltd

Company Coordinates


