
Dashboard
With a Operating Losses, the company has a Weak Long Term Fundamental Strength
- Company's ability to service its debt is weak with a poor EBIT to Interest (avg) ratio of -0.03
- The company has been able to generate a Return on Equity (avg) of 1.85% signifying low profitability per unit of shareholders funds
Flat results in Sep 25
Risky - Negative EBITDA
Stock DNA
Other Chemical products
INR 90 Cr (Micro Cap)
NA (Loss Making)
22
0.00%
-0.05
-1.08%
6.08
Total Returns (Price + Dividend) 
Hilltone Softwar for the last several years.
Risk Adjusted Returns v/s
Returns Beta

News
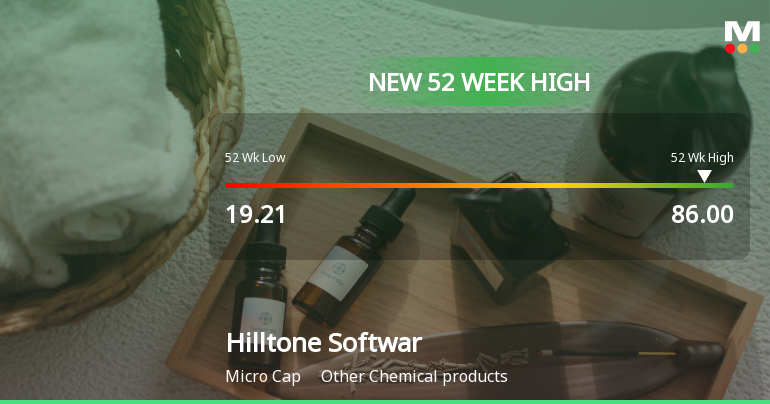
Hilltone Software & Gases Hits New 52-Week High at Rs.86
Hilltone Software & Gases has reached a significant milestone by touching a new 52-week high of Rs.86, marking a notable moment in the stock’s recent performance within the Other Chemical products sector.
Read More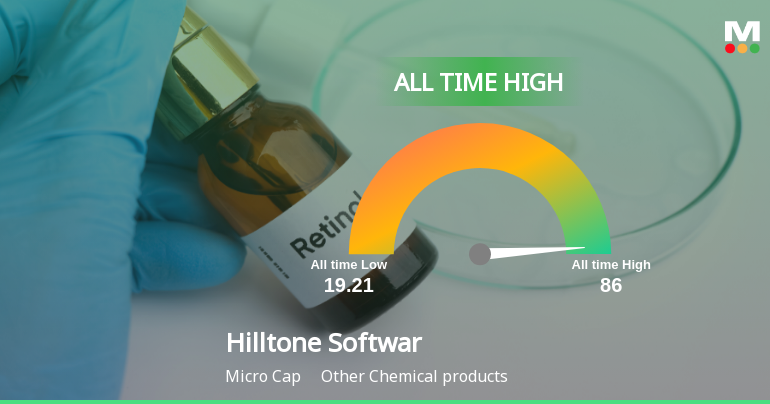
Hilltone Software & Gases Stock Hits All-Time High at Rs.86
Hilltone Software & Gases, a key player in the Other Chemical products sector, reached a new all-time high of Rs.86 today, marking a significant milestone in its market journey. The stock demonstrated robust performance, outpacing its sector and broader market indices with notable gains over recent sessions.
Read More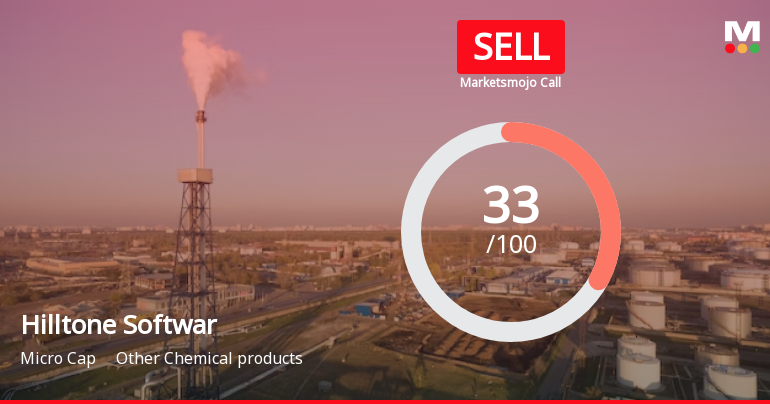
Hilltone Software & Gases Ltd is Rated Sell
Hilltone Software & Gases Ltd is rated 'Sell' by MarketsMOJO, with this rating last updated on 03 June 2025. However, the analysis and financial metrics presented here reflect the stock's current position as of 25 December 2025, providing investors with an up-to-date view of the company’s fundamentals, valuation, financial trends, and technical outlook.
Read More Announcements
FINANCIAL RESULTS FOR QTR Ending 30/09/2025
24-Dec-2025 | Source : BSEFinancial Results for QTR ending on 30/09/2025
Financial Results For QTR Ending On 30/09/2025
10-Dec-2025 | Source : BSEFinancial Results with LRR for Qtr ending on 30/09/2025
Board Meeting Outcome for The Board Of Directors In Its Meeting Held On 29Th November 2025 Have Decided To Allot 2247000 Equity Shares To Non-Promoters Investors On Preferential Basis
29-Nov-2025 | Source : BSEThe Board of Directors in its meeting held on 29th November 2025 have decided to issue and allot 2247000 equity shares to non-promoters investors preferential on preferential basis
Corporate Actions

No Upcoming Board Meetings

No Dividend history available

No Splits history available

No Bonus history available

No Rights history available
Quality key factors
Valuation key factors
Technicals key factors
 Technical Indicator Scale: Bearish, Mildly Bearish, Sideways, Mildly Bullish, Bullish Turned
 Shareholding Snapshot : Sep 2025
Shareholding Compare (%holding)
Non Institution
None
Held by 0 Schemes
Held by 2 FIIs (0.1%)
Hitalbhai Mahendrabhai Shah (6.13%)
Virali Vicky Jhaveri (7.32%)
55.57%
Quarterly Results Snapshot (Standalone) - Sep'25 - QoQ

QoQ Growth in quarter ended Sep 2025 is 47.44% vs 15.84% in Jun 2025

QoQ Growth in quarter ended Sep 2025 is -294.44% vs 61.70% in Jun 2025
Half Yearly Results Snapshot (Standalone) - Sep'25
Not Applicable: The company has declared_date for only one period
Not Applicable: The company has declared_date for only one period
Nine Monthly Results Snapshot (Standalone) - Dec'24
Not Applicable: The company has declared_date for only one period
Not Applicable: The company has declared_date for only one period
Annual Results Snapshot (Standalone) - Mar'25
YoY Growth in year ended Mar 2025 is 9.78% vs 67.89% in Mar 2024
YoY Growth in year ended Mar 2025 is -131.37% vs 920.00% in Mar 2024
About Hilltone Software & Gases Ltd

Company Coordinates


