
Dashboard
High Debt company with Weak Long Term Fundamental Strength
- High Debt Company with a Debt to Equity ratio (avg) at 8.01 times
- The company has been able to generate a Return on Capital Employed (avg) of 6.78% signifying low profitability per unit of total capital (equity and debt)
Flat results in Jan 70
With ROCE of 6.9, it has a Very Expensive valuation with a 2.5 Enterprise value to Capital Employed
Consistent Underperformance against the benchmark over the last 3 years
Total Returns (Price + Dividend) 
Adani Green for the last several years.
Risk Adjusted Returns v/s
Returns Beta

News
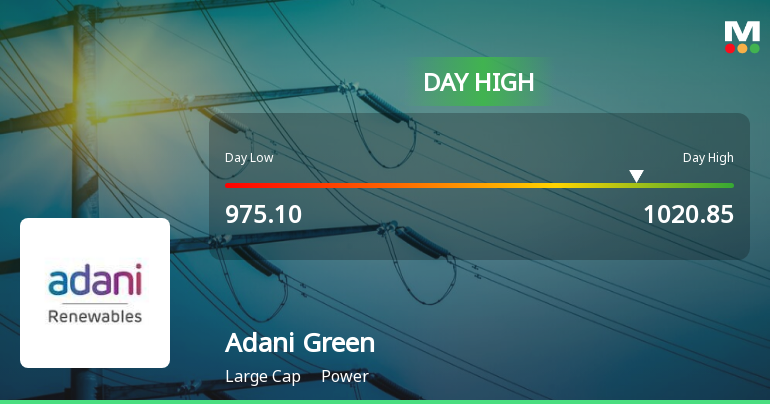
Adani Green Energy Hits Intraday High with Strong Trading Momentum
Adani Green Energy recorded a robust intraday performance today, touching a high of Rs 1,020.65, reflecting a 3.08% rise during trading hours. The stock outpaced its sector and broader market indices, supported by favourable market conditions and sustained buying interest.
Read More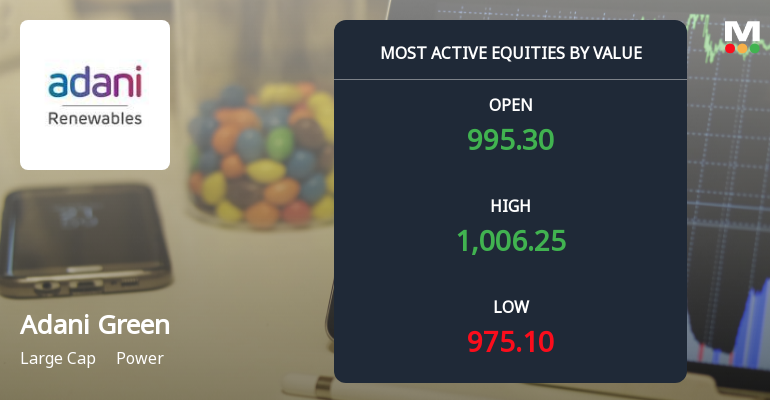
Adani Green Energy Sees High Value Trading Amidst Mixed Market Signals
Adani Green Energy Ltd has emerged as one of the most actively traded stocks by value on 11 Dec 2025, reflecting significant investor interest and notable trading volumes. The stock’s performance today shows a modest gain relative to its sector and the broader Sensex, while trading activity highlights a dynamic market environment for this large-cap power sector player.
Read More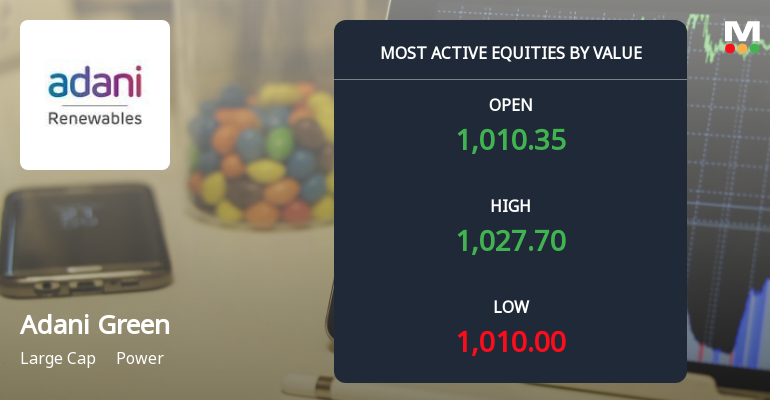
Adani Green Energy Sees Robust Trading Activity Amid Rising Investor Interest
Adani Green Energy Ltd has emerged as one of the most actively traded stocks by value on 10 Dec 2025, reflecting heightened investor participation and significant liquidity in the power sector. The stock’s performance today outpaced its sector peers and the broader Sensex, underscoring its prominence in the market amid ongoing trading momentum.
Read More Announcements
Disclosures under Reg. 29(2) of SEBI (SAST) Regulations 2011
12-Dec-2025 | Source : BSEThe Exchange has received the disclosure under Regulation 29(2) of SEBI (Substantial Acquisition of Shares & Takeovers) Regulations 2011 for Total Energies Renewables Indian Ocean Ltd
ESG Rating By NSE Sustainability Ratings & Analytics Limited
09-Dec-2025 | Source : BSEESG Rating by NSE Sustainability Ratings & Analytics Limited
Announcement under Regulation 30 (LODR)-Newspaper Publication
09-Dec-2025 | Source : BSENewspaper Advertisement for Notice of Extra Ordinary General Meeting
Corporate Actions

No Upcoming Board Meetings

No Dividend history available

No Splits history available

No Bonus history available

No Rights history available
Quality key factors
Valuation key factors
Technicals key factors
 Technical Indicator Scale: Bearish, Mildly Bearish, Sideways, Mildly Bullish, Bullish Turned
 Shareholding Snapshot : Sep 2025
Shareholding Compare (%holding)
Promoters
None
Held by 29 Schemes (1.64%)
Held by 216 FIIs (11.29%)
Adani Trading Services Llp (28.8%)
Totalenergies Renewables Indian Ocean Ltd (15.58%)
3.73%
Quarterly Results Snapshot (Consolidated) - Sep'25 - QoQ

QoQ Growth in quarter ended Sep 2025 is -20.84% vs 23.66% in Jun 2025
QoQ Growth in quarter ended Sep 2025 is -18.23% vs 210.00% in Jun 2025
Half Yearly Results Snapshot (Consolidated) - Sep'25
Growth in half year ended Sep 2025 is 17.40% vs 32.34% in Sep 2024

Growth in half year ended Sep 2025 is 79.50% vs 4.03% in Sep 2024
Nine Monthly Results Snapshot (Consolidated) - Dec'24
YoY Growth in nine months ended Dec 2024 is 21.60% vs 28.98% in Dec 2023
YoY Growth in nine months ended Dec 2024 is 27.79% vs 103.86% in Dec 2023
Annual Results Snapshot (Consolidated) - Mar'25
YoY Growth in year ended Mar 2025 is 21.61% vs 18.57% in Mar 2024
YoY Growth in year ended Mar 2025 is 31.27% vs 12.94% in Mar 2024
About Adani Green Energy Ltd

Company Coordinates


